
Figures & data
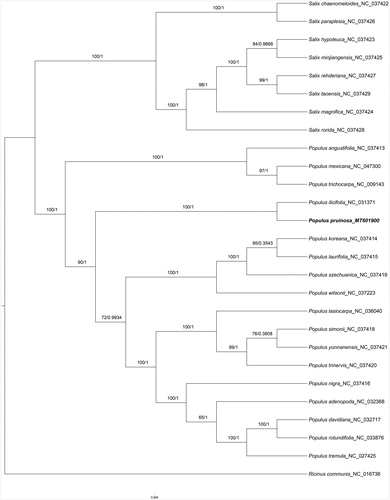
Figure 1. Phylogenetic tree inferred by both maximum-likelihood and Bayesian analysis from 27 species. The values on each node represent the bootstrap values from maximum-likelihood (left) and the posterior probability from Bayesian inference (right), respectively. The bold part is P. pruinosa in this study..
Data availability statement
The data that support the findings of this study are openly available in Genbank (https://www.ncbi.nlm.nih.gov/genbank/) according to their Genbank accession.