
Figures & data
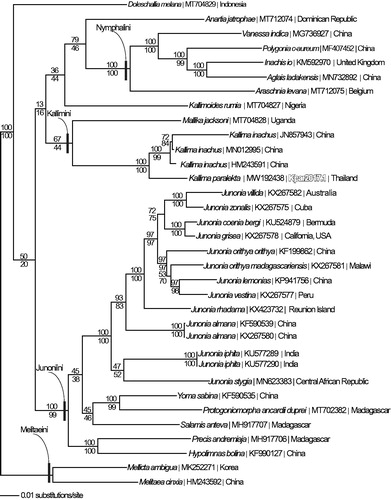
Figure 1. Maximum likelihood phylogeny (GTR + G model, G = 0.2300, likelihood score 116120.69888) of Kallima paralekta and 33 additional mitogenomes from subfamily Nymphalinae based on 1 million random addition heuristic search replicates (with tree bisection and reconnection). One million maximum parsimony heuristic search replicates produced an identical tree topology (parsimony score 20514 steps). Numbers above each node are maximum likelihood bootstrap values and numbers below each node are maximum parsimony bootstrap values (each from 1 million random fast addition search replicates).
Data availability statement
The data that support the findings of this study are openly available in GenBank of NCBI at https://www.ncbi.nlm.nih.gov, reference numbers PRJNA667707, MW192438, and MW192439.