
Figures & data
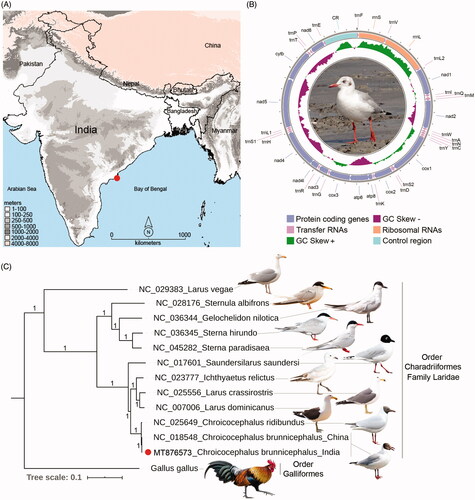
Figure 1. (A) Map showing the collection locality of C. brunnicephalus from the southern coast of India. (B) The spherical representation of mitochondrial genome of C. brunnicephalus. Direction of gene transcription is indicated by arrows. PCGs are shown as blue arrows, rRNA genes as coral arrows, tRNA genes as orchid arrows, and non-coding control region as mint rectangle. The GC-skew is plotted using green and violet color sliding window as the deviation from the average in the complete mitogenome. The species photograph was taken by the third author (G.M.) (C) The BA phylogeny based on the concatenated nucleotide sequences of 13 PCGs showing the evolutionary relationship of the studied taxa with other Laridae species. The posterior probability support values were superimposed with each node. The figure was edited with the representative species photograph acquired from the internet using Adobe Photoshop CS version 8.0.
Data availability statement
The complete mitochondrial genome data that support the findings of this study are openly available in NCBI GenBank database at (https://www.ncbi.nlm.nih.gov) with the accession number (MT876573/NC_050864) which permits unrestricted use, distribution, and reproduction in any medium, provided the original work is properly cited.