
Figures & data
Table 1. Comparison of chloroplast sequences of the seven samples.
Figure 1. Chloroplast reference genome of seven Solanum species. Genes shown inside the outer circle are transcribed counter clockwise and those outside are transcribed clockwise. Genes belonging to different functional groups are color-coded. The gray area in the inner circle indicates the GC content (see and for sample details).
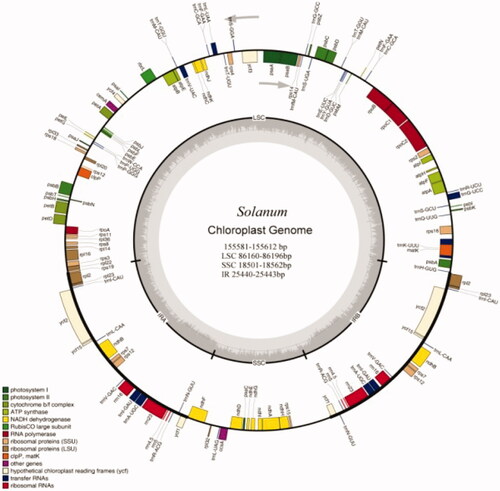
Table 2. List of genes encoded in the chloroplast genome of the seven Solanum species.
Table 3. SNP types of the chloroplast genomes of the seven Solanum species.
Table 4. InDel types of the chloroplast genomes of the seven Solanum species.
Figure 2. Phylogenetic analysis of the seven Solanum species.
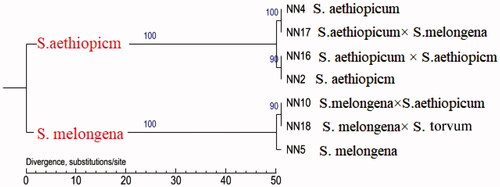
Table 5. Basic information of the seven Solanum plants.
Data availability statement
The raw data that support the findings of this study are openly available in GenBank of NCBI at https://www.ncbi.nlm.nih.gov, reference numbers: SAMN16746488, SAMN16746490, SAMN16746491, SAMN16746496, SAMN16746503, SAMN16746502, and SAMN16746504.