
Figures & data
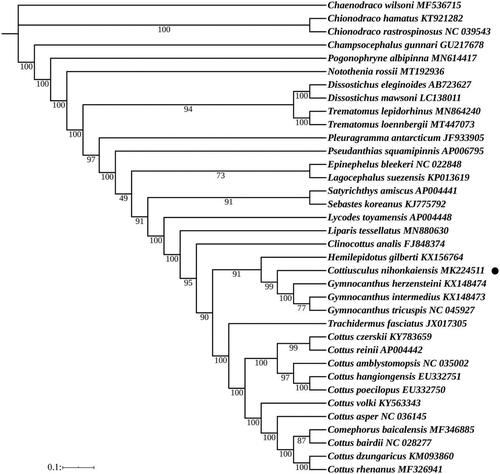
Figure 1. Phylogenetic analysis based on the nucleotide sequences of the 13 PCGs in the mitogenome. Maximum Likelihood analyses (bootstrap support with 1000 replications) are shown next to nodes. The number after the species name was the GenBank accession number. The genome sequence in this study was labeled with a black dot.
Data availability statement
The data that support the findings of this study are openly available in “NCBI” athttps://www.ncbi.nlm.nih.gov/nuccore/MK224511. GenBank accession number: MK224511.1.