
Figures & data
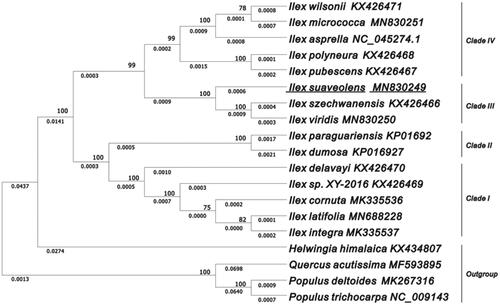
Figure 1. The evolutionary tree was constructed by MEGA X using the Maximum Likelihood method and the Tamura-Neighbour model. The percentage of phylogenetic trees associated with taxa is shown next to the branches. The analyses involved 15 plastomes of Ilex species with P. trichocarpa, P. deltoides, Q. acutissima, and H. himalaica rooted as the outgroup. The bootstrap values are shown on the branches of the phylogenetic tree based on 1000 replicates.
Data availability statement
The complete plastid genome data that support the findings of this study are openly available in the GenBank of NCBI (https://www.ncbi.nlm.nih.gov/) under the accession number of MN830249. The raw sequence reads have been deposited in GSA database (https://bigd.big.ac.cn/gsa/) associated with the accession number of CRR147931.