
Figures & data
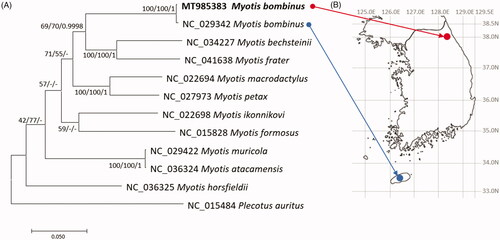
Figure 1. (A) Maximum-likelihood (1,000 bootstrap repeats), neighbor-joining (10,000 bootstrap repeats), and Bayesian Inference (1,100,000 generations) phylogenetic trees of 11 Myotis mitochondrial genomes and one Plecotus mitogenomes: two M. bombinus, M. bechsteinii, M. frater, M. macrodactylus, M. petax, M. ikonnikovi, M. horsfieldii, M. muricola, M. atacamensis, M. formosus, and P. auratus. Phylogenetic tree was drawn based on maximum-likelihood tree. The numbers above branches indicate bootstrap support values of maximum-likelihood and neighbor-joining phylogenetic trees and posterior probability value of Bayesian Inference tree, respectively. (B) displays geographical location of two M. bombinus samples: red circle indicates the sample used in this study and blue circle means the sample used in the previous study (NC_029342; Kim et al. Citation2017).
Data availability statement
Mitochondrial genome sequence can be accessed via accession number MT985383 in NCBI GenBank.