
Figures & data
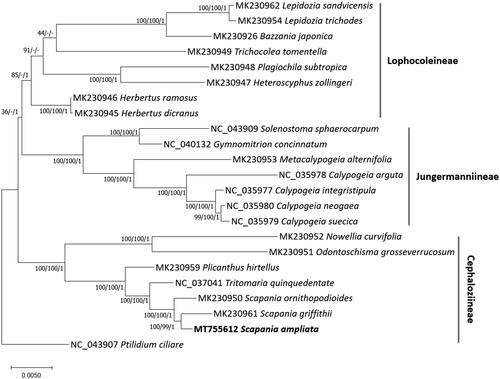
Figure 1. Neighbor-Joining (bootstrap repeat is 10,000), Maximum-Likelihood (bootstrap repeat is 1,000), and Bayesian Inference (Number of generations is 1,100,000) phylogenetic trees of twenty-three complete mitochondrial genomes. Phylogenetic tree was drawn based on Maximum-lLkelihood phylogenetic tree. The numbers above branches indicate bootstrap support values of Maximum-Likelihood, Neighbor-Joining, and Bayesian Inference phylogenetic trees, respectively.
Data availability statement
Mitochondrial genome sequence can be accessed via accession number MT755612 in GenBank of NCBI at https://www.ncbi.nlm.nih.gov. The associated BioProject, SRA, and Bio-Sample numbers are PRJNA691085, SAMN17277783, and SRR13399294, respectively.