
Figures & data
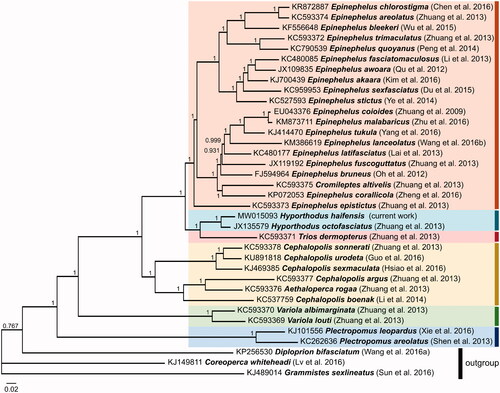
Figure 1. Bayesian Inference based phylogeny depicting the mitogenomic relationship (excluding the control region) between 33 Epinephelini species using other Serranidae species as outgroup. Each label includes the GenBank accession number, species, and reference (listed in the Supplementary Material). The numbers at the nodes indicate the posterior probability values. This analysis used 5 × 10⁶ generations, a sample frequency every 1,000 generations and a burn-in of 25%.
Supplemental material
Supplemental Material
Download MS Word (14.8 KB)Data availability statement
The genome sequence data that support the findings of this study are openly available in GenBank of NCBI at https://www.ncbi.nlm.nih.gov under the accession no. MW015093. The associated BioProject number is PRJNA661720.