
Figures & data
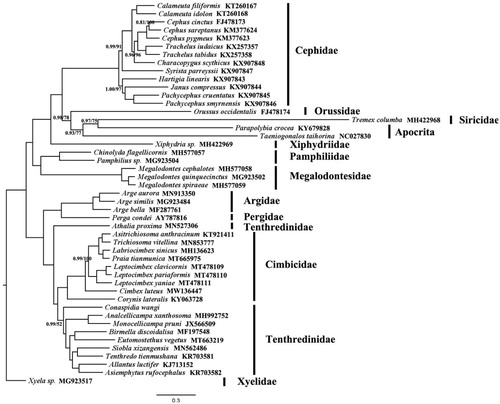
Figure 1. BI and ML approaches were used to construct the phylogenetic tree, based on 13 PCGs. The number on each node is posterior probability. Support values lower than 1.0 in the BI analysis and 100% in the ML analysis were shown. GenBank accession number for each species was provided with species name.
Data availability statement
The data that support the findings of this study are openly available in figshare at https://figshare.com/s/e60e95a596a63f43e6ba.