
Figures & data
Figure 1. Comparison of the junction between inverted repeat region (IR), large single copy-region (LSC) and small single copy-region (SSC) of chloroplast genome among eight Coix species (varieties).
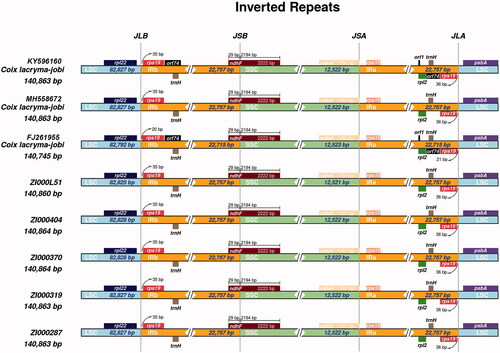
Figure 2. Comparison of eight chloroplast genomes of adlay. Note: Gray arrows and thick black lines above the alignment indicate gene orientation. Purple bars represent exons, pink bars represent conserved non-coding sequences (CNS), and blue bars represent mRNA. The y-axis represents the percentage identity (shown: 50–100%).
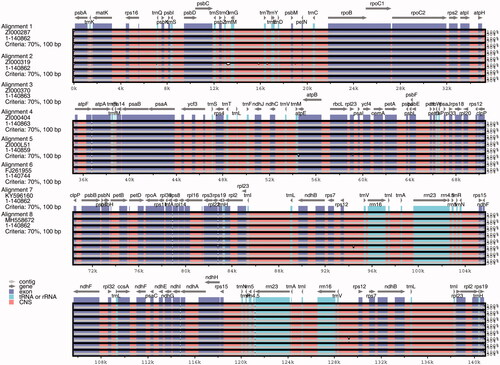
Figure 3. Statistics of InDel variations.
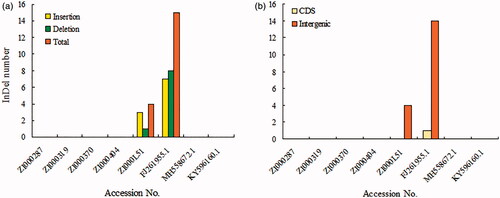
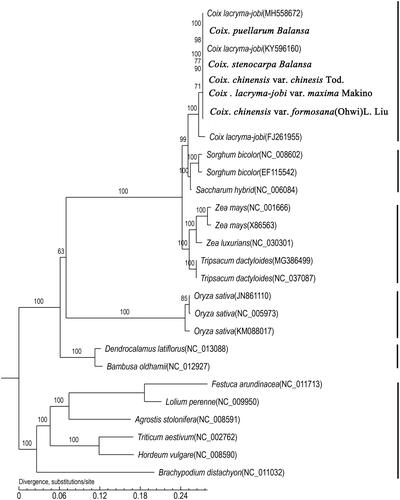
Figure 4. Maximum likelihood (ML) phylogenetic tree. Note: The phylogenetic tree including eight Coix species(varieties) and nineteen other species based on concatenated sequences from all chloroplast genomes.
Data availability statement
The five genome sequences assembly has been deposited into NCBI GenBank under project ID: MT471102 (C. puellarum Balansa)(https://www.ncbi.nlm.nih.gov/nuccore/MT471102), MT471094 (C. stenocarpa Balansa)(https://www.ncbi.nlm.nih.gov/nuccore/MT471094), MT471095 (C.lacryma-jobi var. maxima Makino) (https://www.ncbi.nlm.nih.gov/nuccore/MT471095), MT471096 (C. chinensisvar. chinesis Tod.) (https://www.ncbi.nlm.nih.gov/nuccore/MT471096), MT471101 (C. chinensis var. formosana(Ohwi)L. Liu) (https://www.ncbi.nlm.nih.gov/nuccore/MT471101).