
Figures & data
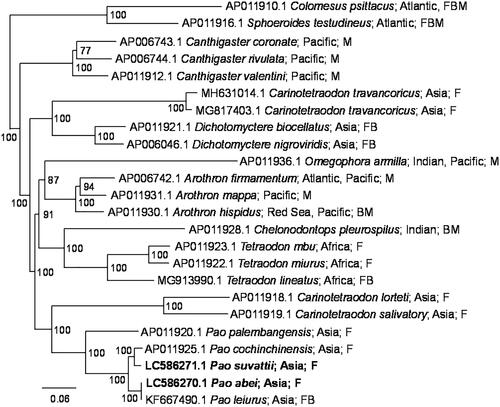
Figure 1. Phylogenetic relationship of Pao and related species inferred from concatenated nucleotide sequences of 13 CDSs using Bayesian inference. In the Bayesian analysis, the best fit model (GTR + G+I model) was selected by Kakusan4 (Tanabe Citation2011), 12 runs of 2.5 million generations were performed with four chains each, trees were sampled at 1000-generation intervals, and the first 10% of the trees were discarded as burn-in. The new sequences are shown in bold. Distributions and habitats (F: fresh water, B: brackish water; M: marine water) given by Fricke et al. (Citation2021) are indicated with accession numbers and species names. Numbers at each node represent Bayesian posterior probabilities. C. psittacus and S. testudineus were used as outgroups.
Data availability statement
All assembled mitochondrial genomes are available on GenBank using the ascension numbers: LC586270 and LC586271.