
Figures & data
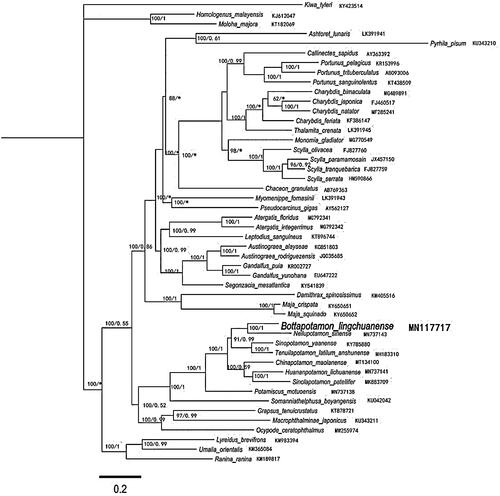
Figure 1. Phylogenetic maximum-likelihood (ML) tree of Bottapotamon lingchuanense and related brachyurans based on 13 PCGs nucleotide sequences from the mitochondrial genome. The numbers are Bayesian inference (BI) proportions and ML proportions. The differences between the ML and BI trees are indicated by ‘*’. The scale bars represent distance.
Data availability statement
The genome sequence data that support the findings of this study are openly available in GenBank of NCBI at https://www.ncbi.nlm.nih.gov/ under the accession no. MN117717.