
Figures & data
Table 1. Basic features of the 14 cp genomes from Scutellaria.
Figure 1. Graphic representation of features identified in the cp genomes of Scutellaria plants by using CPGAVAS2. Taking S. tsinyunensis as an example, the map contains four rings. From the center going outward, the first circle shows the forward and reverse repeats connected with red and green arcs, respectively. The next circle shows the tandem repeats marked with short bars. The third circle shows the microsatellite sequences identified using MISA. The fourth circle is drawn using drawgenemap and shows the gene structure on the cp genomes. The genes were colored based on their functional categories, which are shown in the left corner. Label intron-containing genes with *.
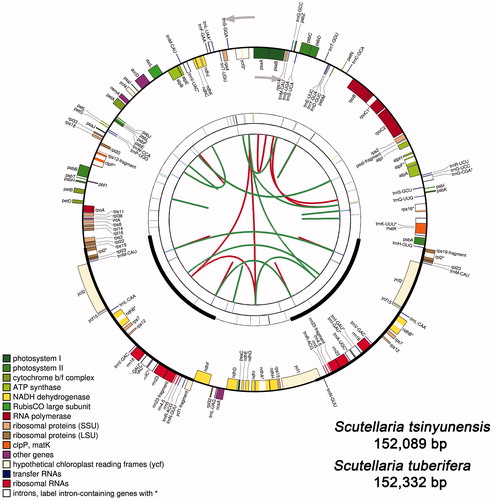
Table 2. Gene contents of the cp genomes in Scutellaria plants.
Figure 2. Comparison of the borders among LSC, SSC, and IR regions of 14 analyzed species. The genes around the borders are shown above or below the main line. The JLB, JSB, JSA, and JLA represent junction sites of LSC/IRb, IRb/SSC, SSC/IRa, and IRa/LSC, respectively.
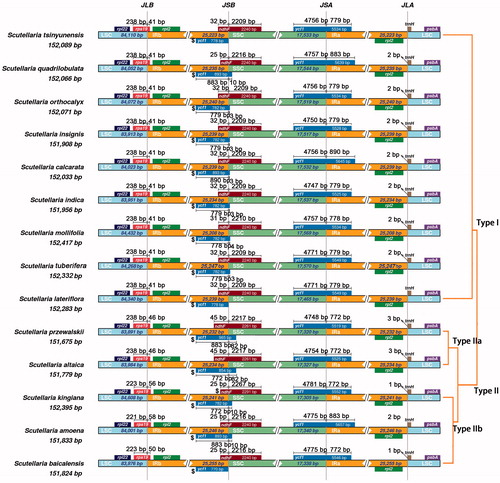
Figure 3. Genetic characteristics among protein-coding genes of chloroplast in Scutellaria. A. Nucleotide diversity (Pi) and percent variability (PV) of 78 orthologous genes. B. Estimations of nonsynonymous (dN), synonymous (dS) substitution rates, and their ratio (dN/dS) of 78 orthologous genes. A few maximum values were marked with ‘#’.
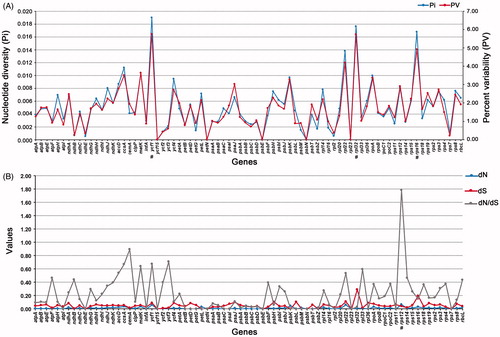
Table 3. Mean K2-P distance of 89 IGS of cp genomes from Scutellaria.
Figure 4. Boxplot for pairwise comparison of the K2-P distance among 89 intergenic spacers (IGS) of 14 Scutellaria species. The ‘× in each boxplot represents the average K2-P distance. Three IGS had mean K2-P distance over 5, they are ndhF-rpl32 (5.8178), trnL-UAG-ccsA (6.1056) and rpl32-trnL-UAG (10.5154).
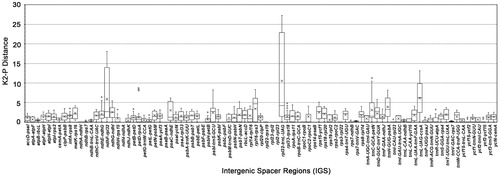
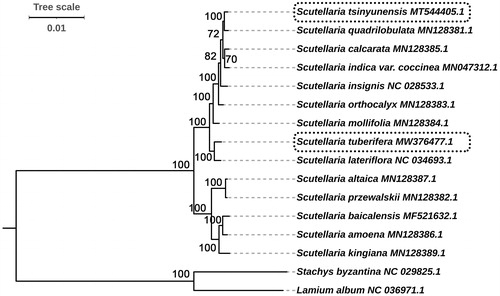
Figure 5. Phylogenetic relationships of Scutellaria species inferred using maximum-likelihood (ML) method. The phylogenetic tree was constructed using complete cp genome sequences. The number at the bottom of the scale, 0.01, means that the length of the branch represents the replacement frequency of bases at each site of the genome at 0.01. Bootstrap values were calculated from 1000 replicates. Two taxa, namely, Lamium album and Stachys byzantina were used as outgroups.
Supplemental Material
Download MS Word (43.5 KB)Data availability statement
The raw sequencing data and two genome sequences have been deposited in NCBI (https://www.ncbi.nlm.nih.gov/) with accession number: PRJNA680174, MT544405.1 (S. tsinyunensis), and MW376477.1 (S. tuberifera). The sample has been deposited in the herbarium of Southwest University, Chongqing, China with the accession number: 20200320CQ-1 and 20200320CQ-2, respectively.