
Figures & data
Figure 1. Graphic representation of features identified in J. ventricose plastome by using CPGview-RSG (http://www.herbalgenomics.org/cpgview). The map contains seven circles. From the center going outward, the first circle shows the distributed repeats connected with red (the forward direction) and green (the reverse direction) arcs. The next circle shows the tandem repeats marked with short bars. The third circle shows the microsatellite sequences as short bars. The fourth circle shows the size of the LSC and SSC. The fifth circle shows the IRA and IRB. The sixth circle shows the GC contents along the plastome. The seventh circle shows the genes having different colors based on their functional groups.
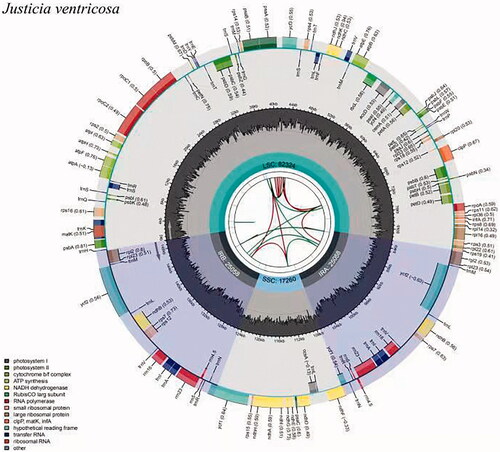
Figure 2. Schematic presentation of the structure of cis-splicing genes from the plastome of J. ventricosa. The white area is Intron, and the black area is the exon. The arrow shows the sense direction of the genes.
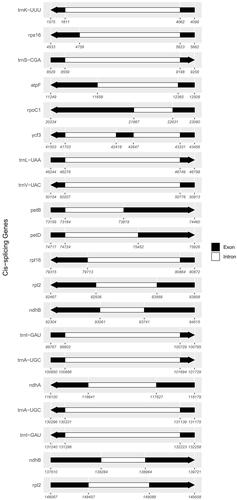
Table 1. Genes contents of J. ventricose chloroplast genome.
Table 2. Microsatellites in the J. ventricosa plastome.
Table 3. Tandem repeats in the J. ventricosa plastome.
Table 4. Interspersed repeats in the J. ventricosa plastome.
Figure 3. Comparison of LSC, SSC, and IR boundaries of four Justicia species. The genes around the border are shown above or below the central horizontal thick line representing the genome. The Latin names and plastome length are shown on the left. JLB, JSB, JSA, and JLA represent the junction sites of LSC/IRb, IRb/SSC, SSC/IRa, and IRa/LSC, respectively. The distances from the start and end of different genes to the junction sites are displayed above and below the corresponding genes.
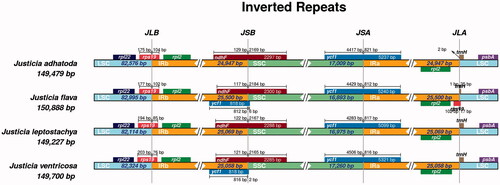
Figure 4. Average K2p distances among the intergenic spacer regions from the four Justicia species: J. adhatoda, J. leptostachya, J. pseudospicata, and J. ventricosa. The K2p distances were calculated for the corresponding IGS regions pairwisely. The black dots represent the average K2p distances for the corresponding IGS regions.
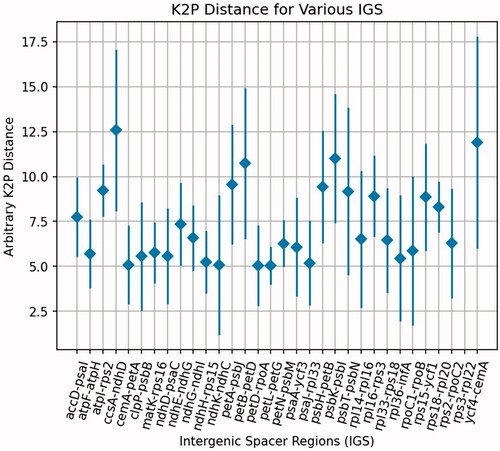
Table 5. Selection pressure analysis.
Table 6. Primers for amplifying DNA barcodes to distinguish the four Justicia species: J. ventricosa, J. leptostachya, J. nutans, and J. adhatoda.
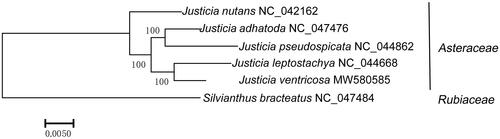
Figure 5. The phylogenetic tree of five Justicia species of Acanthaceae and Silvianthus bracteatus selected as the outgroup. The tree was constructed using the maximum-likelihood method. Bootstrap support values were calculated from 1000 replicates.
Data availability statement
The data that support the findings of this study are openly available in the GenBank database at https://www.ncbi.nlm.nih.gov with the accession number is MW580585. The associated BioProject, SRA, and Bio-Sample numbers are PRJNA717803, SRR14085608, and SAMN18511406, respectively.