
Figures & data
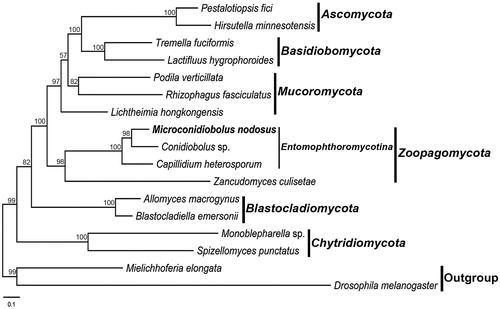
Figure 1. Phylogenetic tree constructed by maximum likelihood analyses based on 14 translated mitochondrial proteins. They included oxidase subunits (Cox1, 2, and 3), the apocytochrome b (Cob), ATP synthase subunits (Atp6, Atp8, and Atp9), NADH dehydrogenase subunits (Nad1, 2, 3, 4, 5, 6, and Nad4L). The 14 fungal mitogenomes were used in this phylogenetic analysis. Drosophila melanogaster and Mielichhoferia elongata were served as outgroups. Maximum likelihood bootstrap values (500 replicates) of each clade are indicated along branches. Scale bar indicates substitutions per site.
Data availability statement
The data that support the findings of this study are openly available in NCBI (https://www.ncbi.nlm.nih.gov/). The accession number is MW_795365.