
Figures & data
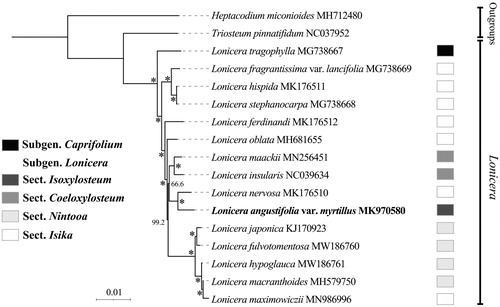
Figure 1. A phylogenetic tree of Lonicera L. inferred from the maximum-likelihood method based on the complete chloroplast genome data. *The clade support value of 100 that was generated from the maximum likelihood method. The taxonomic groups are following Rehder (Citation1903, Citation1913), Hara (Citation1983), and Hsu and Wang (Citation1988).
Data availability statement
The genome sequence data that support the findings of this study are openly available in GenBank of NCBI at https://www.ncbi.nlm.nih.gov/ under the accession MK970580. Raw Illumina data were deposited in the NCBI Sequence Read Archive (SRA: SUB8882578, BioProject: PRJNA691677, and Bio-Sample: SAMN17302025).