
Figures & data
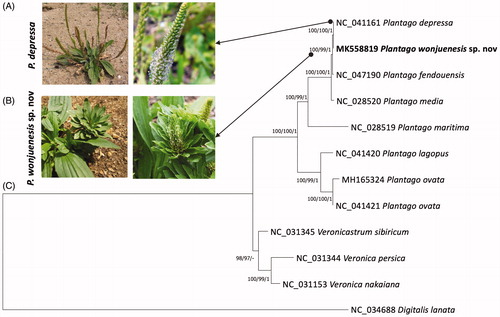
Figure 1. (A,B) display the shape of P. depressa and P. wonjuenesis sp. nov, respectively. (C) presents Maximum Likelihood (bootstrap repeat is 1000), Neighbor-joining (bootstrap repeat is 10,000), and Bayesian inference (Number of generations is 1,100,000) phylogenetic trees of eleven Plantaginaceae chloroplast genomes. Phylogenetic tree was drawn based on Maximum Likelihood tree. The numbers above branches indicate bootstrap support values of Maximum Likelihood and Neighbor-joining trees and posterior probability of Bayesian inference tree.
Data availability statement
Chloroplast genome sequence can be accessed via accession number MK558819 in GenBank of NCBI at https://www.ncbi.nlm.nih.gov. The associated BioProject, SRA, and Bio-Sample numbers are PRJNA669482, SAMN16446523, and SRR12834755, respectively.