
Figures & data
Figure 1. Sampling locations of Thunnus maccoyii, which G1 and G2 indicate samples from the eastern Indian Ocean and the eastern Atlantic Ocean, respectively.
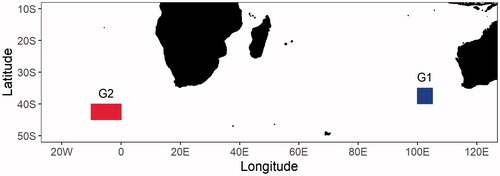
Figure 2. The phylogenetic tree based on the maximum-likelihood (ML) using Tamura-Nei model with 1000 bootstrap replications, for the combined mtDNA gene sequences (1240-bp) for T. maccoyii. G1 and G2 indicate samples from the estern Indian Ocean and the eastern Atlantic Ocean, respectively.
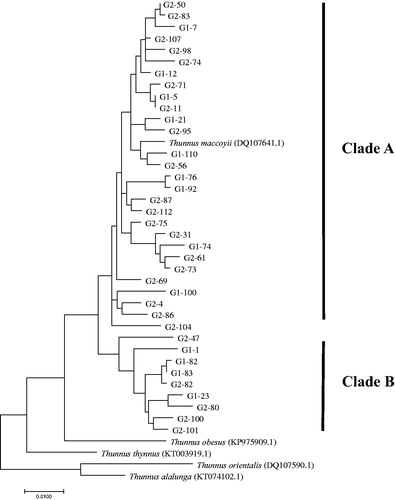
Table 1. mtDNA sequence variability in the cytochrome c oxidase subunit I (COI), control region (CR) and the combined genes for Thunnus maccoyii.
Table 2. Analysis of molecular variance (AMOVA) results for the genetic structure of T. maccoyii based on the combined mtDNA sequence.
Table 3. Summary of the combined mtDNA sequence variability for two clades of T. maccoyii.
Data availability statement
The data that support the findings of this study are openly available in [NCBI] at [https://www.ncbi.nlm.nih.gov/], reference number [MZ222168-MZ222241].