
Figures & data
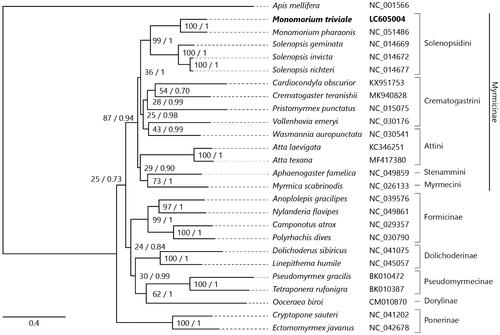
Figure 1. Maximum-likelihood (1000 bootstrap repeats) and Bayesian inference (100,000 generations) trees showing phylogenetic relationships among 25 ant species. A honeybee, Apis mellifera was used as an outgroup. Phylogenetic tree was drawn based on maximum-likelihood tree. Monomorium triviale in bold is the result obtained in this study. The numbers above branches indicate bootstrap support values for maximum-likelihood tree and posterior probability for Bayesian inference tree, in order.
Data availability statement
The genome sequence data that support the findings of this study are openly available in DDBJ/GenBank at https://www.ddbj.nig.ac.jp under the accession no. LC605004. The associated BioProject, SRA, and Bio-Sample numbers are PRJDB12079, DRX301164, and SAMD00394597, respectively.