
Figures & data
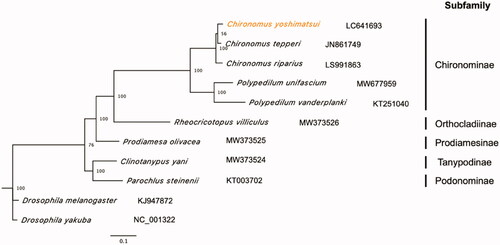
Figure 1. Maximum likelihood tree based on 13 PCGs and 2 rRNAs in mitochondrial genomes of Chironomidae family. Orange represents the genome obtained in this study. Drosophila melanogaster and D. yakuba were used as the outgroup. Non-parametric bootstrap values (based on 3,000 times resampling) are shown at nodes. The scale bar indicates the number of amino acid substitutions per site.
Data availability statement
Data that support the findings of this study are openly available at INSDC nucleotide database with the accession number LC641693, and at Sequence Read Archives with the accession number PRJDB11895 (BioProject), SAMD00387595 (BioSample), DRX294195 (Experiment), and DRR304759 (Run).