
Figures & data
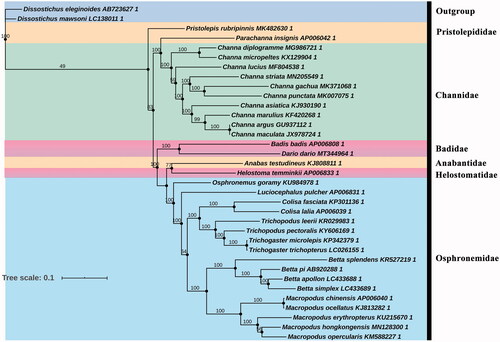
Figure 1. Phylogenetic tree of Anabantiformes species inferred from the 13 PCGs based on maximum-likelihood analysis. Support values for the maximum-likelihood analyses (bootstrap support with 1000 replications) are shown next to nodes. The number after the species name is the GenBank accession number.
Supplemental material
Supplemental Material
Download MS Word (16.4 KB)Data availability statement
The genome sequence data that support the findings of this study are openly available in GenBank of NCBI at https://www.ncbi.nlm.nih.gov/ under the accession no. MT344964.1.