
Figures & data
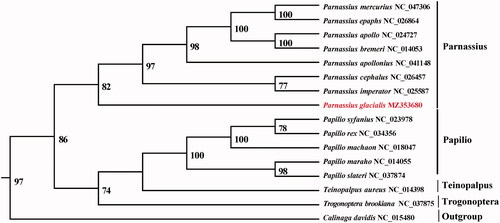
Figure 1. Maximum-likelihood (ML) tree based on 14 mitogenome sequences of representative butterflies that are in Papilioninae as ingroup and Calinaga davidis was designated as outgroup. Numbers on the nodes are bootstrap values based on 1000 replicates. The P. glacialis genome was marked in bold and red font.
Data availability statement
The genome sequence data that support the findings of this study are openly available in GenBank of NCBI (https://www.ncbi.nlm.nih.gov/) under the accession number MZ353680. The associated BioProject, SRA, and Bio-Sample numbers are PRJNA762526, SAMN21397441 and SRR15858608, respectively.