
Figures & data
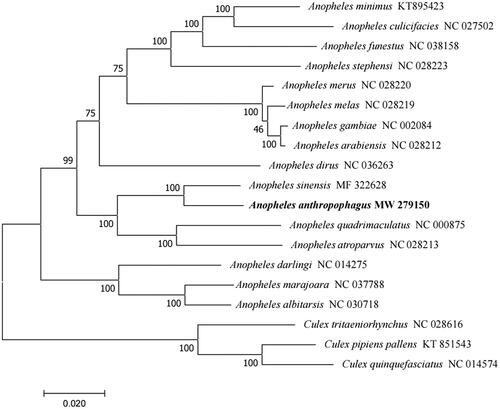
Figure 1. Phylogenetic tree of 16 Anopheles species based on their mitochondrial genomes. Numbers near the nodes represent bootstrap values. The GenBank accession number is listed next to each species within the tree. Culex was used as the outgroup. The branch length scale bar indicates relative differences (0.020 = 2.0% nucleotide difference).
Supplemental Material
Download MS Word (21.1 KB)Data availability statement
The genome sequence data that support the findings of this study are openly available in GenBank of NCBI at (https://www.ncbi.nlm.nih.gov/)under the accession no. MW279150.
Figure 1. Phylogenetic tree of 16 Anopheles species based on their mitochondrial genomes. Numbers near the nodes represent bootstrap values. The GenBank accession number is listed next to each species within the tree. Culex was used as the outgroup. The branch length scale bar indicates relative differences (0.020 = 2.0% nucleotide difference).