
Figures & data
Table 1. Annotation of the mitochondrial genome of Chrysolophus amherstiae (C.a) and Chrysolophus pictus (C.p).
Figure 1. Mitochondrial map of C. amherstiae and C. pictus.
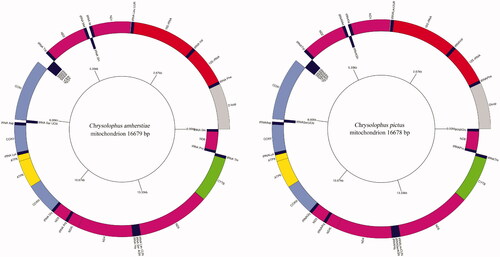
Table 2. Nucleotide composition in PCGs of mitogenomes of Chrysolophus amherstiae (C.a) and Chrysolophus pictus (C.p).
Figure 2. The relative synonymous codon usage (RSCU) in the mitogenomes of C. amherstiae and C. pictus.
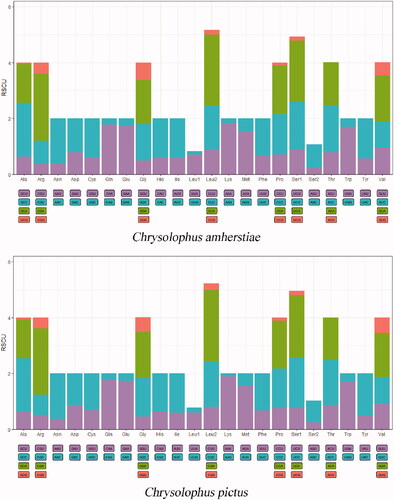
Figure 3. Prognostic map of 12S rRNA secondary structures in C. amherstiae and C. pictus. The different bases are shown in red. I–IV represent structural domains.
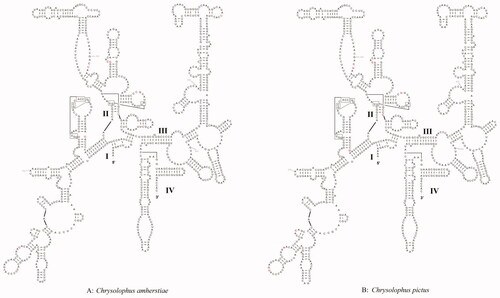
Figure 4. Prognostic map of 16S rRNA secondary structures in C. amherstiae and C. pictus. The different bases are shown in red. The red arrow represents the inserted base. I–VI represent structural domains.
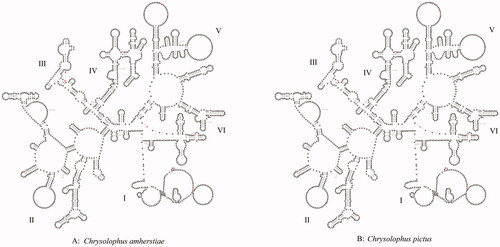
Figure 5. Maximum-likelihood (ML) phylogenetic tree constructed based on complete mitochondrial genomes from 21 species of 10 genera of Phasianidae. Numbers at the branches indicated the bootstrapping values with 10,000 replications. Filled circle represented a sequence from this study.
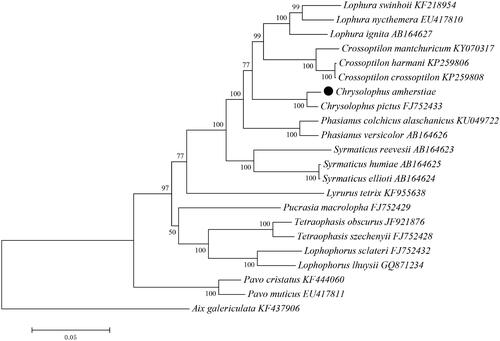
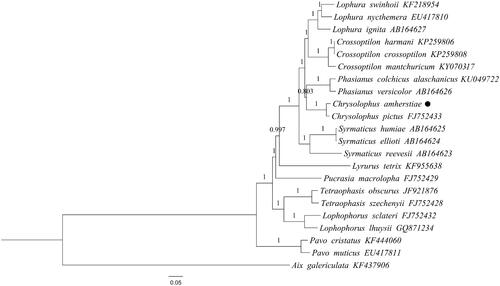
Figure 6. Bayesian inference (BI) phylogenetic tree constructed based on complete mitochondrial genomes from 21 species of 10 genera of Phasianidae. Numbers at the branches indicated the bootstrapping values with 10 million generations. Filled circle represented a sequence from this study.
Data availability statement
The genome sequence data that support the findings of this study are openly available in GenBank of NCBI at https://www.ncbi.nlm.nih.gov/ under the accession no. MW880933.