
Figures & data
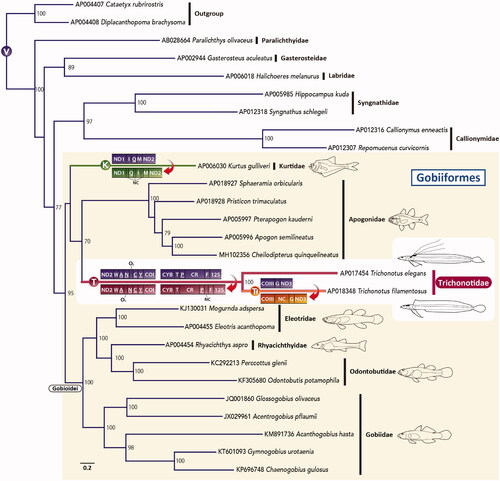
Figure 1. An ML phylogenetic tree was inferred using the program RAxML (Stamatakis Citation2014) and the timing of gene rearrangements in each mitogenome. Accession numbers are indicated before the species names. Bootstrap values above 50% were shown at each node. The analysis was conducted on a data matrix (10,767 positions), including the concatenated nucleotide sequences of protein-coding genes in the mitogenomes, except the ND6 gene. Gene sequences were aligned individually using the online version of MAFFT (http://mafft.cbrc.jp/alignment/server/. ; Katoh and Standley Citation2013), and ambiguous regions were trimmed using the online version of Gblocks with the least stringent settings (http://molevol.cmima.csic.es/castresana/Gblocks_server.html. ; Castresana Citation2000). The optimal partition model was determined using PartitionFinder version 2 (Lanfear et al. Citation2017). Rapid bootstrap analyses were conducted with 1000 replications. Partitioned ML analyses were performed with RAxML-GUI version 2.0.1 (Edler et al. Citation2021) using the GTRGAMMAI nucleotide substitution model. Circled V, K, T, and Tf represent the gene order of typical vertebrates, Kurtus, trichonotids, and T. filamentous, respectively. tRNA genes are designated by single-letter amino acid codes. 12S, 12S rRNA gene; COI and COIII, cytochrome c oxidase subunits I and III genes, respectively; CR, putative control region; Cyt b, cytochrome b gene; NC, noncoding sequences; ND1–3, NADH dehydrogenase subunit 1–3 genes, respectively; OL, the origin of L-strand replication.
Data availability statement
The mitochondrion genome sequence data that support the findings of this study are openly available in GenBank of the National Center for Biotechnology Information (NCBI) at https://www.ncbi.nlm.nih.gov/ under the accession nos. AP006817 and AP018348.