
Figures & data
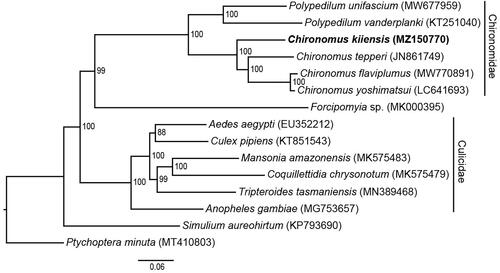
Figure 1. Maximum-likelihood (ML) phylogeny of 14 registered Culicomorpha mitogenomes including C. kiiensis, and Ptychoptera minuta as an outgroup based on the concatenated sequences of mitogenomic PCGs. The phylogenetic analysis was performed under GTR + I + G substitution model for 1000 bootstraps. The numbers at the nodes indicate the ML bootstrap values.
Data availability statement
The data support the findings of this study are openly available in GenBank of NCBI at https://www.ncbi.nlm.nih.gov. The complete mitochondrial genome of Chironomus kiiensis for this study has been deposited in GenBank with accession number MZ150770. The associated BioProject, BioSample and SRA numbers are PRJNA705522, SAMN22359574, and SRR16381213, respectively.