
Figures & data
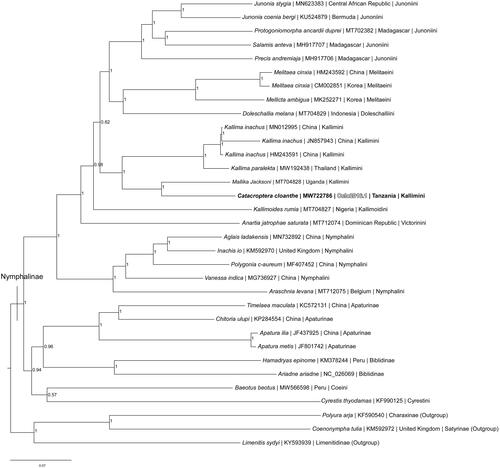
Figure 1. Bayesian Inference phylogeny (GTR + I + G model, average deviation of split frequencies = 0.000639) of the Catacroptera cloanthe mitogenome, 29 additional mitogenomes from 11 tribes within subfamily Nymphalinae, and three outgroup species from other subfamilies within family Nymphalidae (Charaxinae (Polyura arja), Satyrinae (Coenonympha tulia), and Limenitidinae (Limenitis sydyi)) produced by 10 million MCMC iterations in MrBayes with sampling every 1000 generations. The Bayesian posterior probability values determined by MrBayes are given at each node.
Data availability statement
The genome sequence data that support the findings of this study are openly available in GenBank of NCBI at [https://www.ncbi.nlm.nih.gov] (https://www.ncbi.nlm.nih.gov/) under the accession nos. MW722786 and MW722785. The associated BioProject, SRA, and Bio-Sample numbers are PRJNA706380, SRX10228918, and SAMN18128423, respectively.