
Figures & data
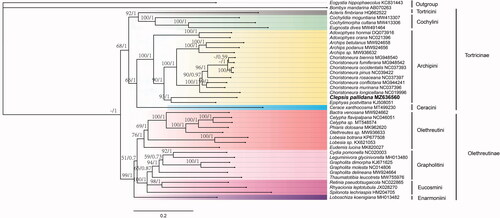
Figure 1. Phylogenetic trees inferred from maximum likelihood and Bayesian inference methods based on the 13 PCGs. Numbers separated by a slash (/) on a node represent the bootstrap support and posterior probability, respectively. The specie with mitogenome sequenced in this study is marked in bold. All GenBank accession numbers of each species were listed in the phylogenetic tree. Eogystia hippophaecolus (KC831443) and Bombyx mandarina (AB070263) were used as outgroup.
Data availability statement
The genomic sequence data supporting the study's findings are publicly available in NCBI's GenBank https://www.ncbi.nlm.nih.gov/under join number. MZ636560.The associated BioProject, BioSample, and SRA numbers are PRJNA785360, SAMN24563661, and SRR17088790, respectively.