
Figures & data
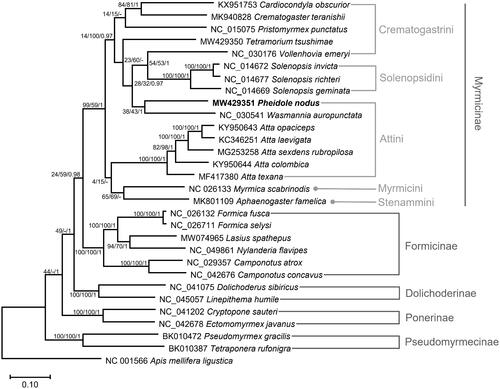
Figure 1. Maximum likelihood phylogenetic tree based on the concatenated PCGs and 2 rTNA genes of 30 Hymenoptera species (29 ants and one bee). Maximum likelihood and Bayesian inference phylogenetic trees were topologically identical. The numbers at the nodes indicate bootstrap support values of maximum likelihood and neighbor-joining trees and posterior probabilities of the Bayesian inference tree.
Data availability statement
The data that support the findings of this study are openly available in GenBank of NCBI at https://www.ncbi.nlm.nih.gov, reference number MW429351. The associated BioProject, SRA, and Bio-Sample numbers are PRJNA772614, SRR16529670 and SAMN22402153, respectively.