
Figures & data
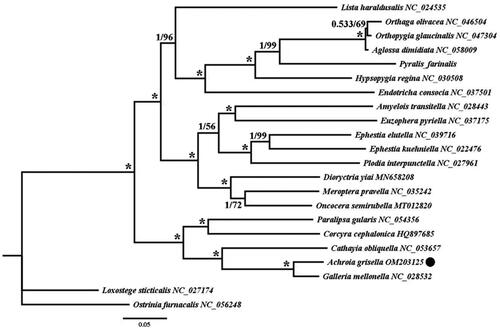
Figure 1. The phylogenetic trees of Achroia grisella were inferred from the amino acid sequences of the 13 PCGs in mitogenome of 22 species from using Bayesian inferences (BI) and maximum likelihood (ML) methods. Numbers on branches indicate BI posterior probability (PP, left) and ML bootstrap support (BS, right), respectively. An asterisk denotes PP =1 and BS = 100. The black dot indicates mitogenome of Achroia grisella newly determined in this study.
Data availability statement
The data that support the findings of this study are openly available at NCBI database. The GenBank Accession No. (reference number) is OM203125 (https://www.ncbi.nlm.nih.gov/.). The associated BioProject, SRA, and Bio-Sample numbers are PRJNA792436, SRS11402858, and SAMN24425024, respectively, and all of the accession numbers are activated.