
Figures & data
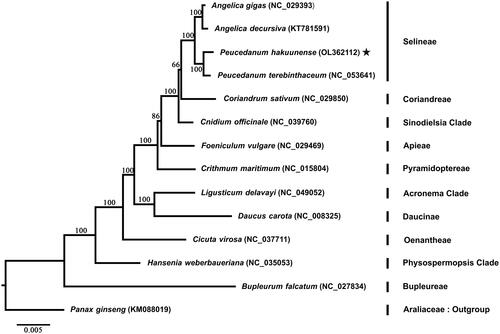
Figure 1. Phylogenetic analysis of Apiaceae based on 78 plastid genes from 14 species. Star indicates the newly generated plastome of P. hakuuense in this study. A phylogenetic tree was reconstructed using the maximum-likelihood method in raxmlGUI 2.0 with 1000 bootstrap replicates. Numbers at the node are the bootstrap supporting value calculated from the ML method. The plastome sequence of Panax ginseng from Araliaceae was included as an outgroup.
Data availability statement
The plastid genome sequence data supporting this study’s finding is available in NCBI GenBank under the accession number OL362112. The associated BioProject, SRA, and Bio-sample numbers are PRJNA775900, SRR16611559, and SAMN22635847, respectively.