
Figures & data
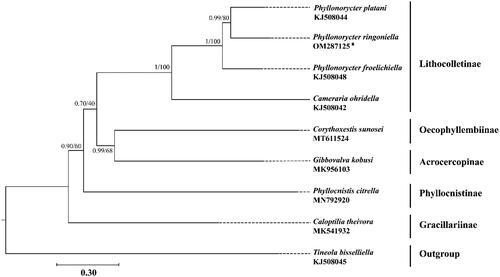
Figure 1. Phylogenetic tree using maximum likelihood (ML) analyses based on concatenated nucleotide sequences of 13 PCGs. Bayesian inference (BI) analyses show the same topology (not shown). The numbers under the branches are Bayesian posterior probabilities and bootstrap support values. Alphanumeric terms indicate the GenBank accession numbers.
Data availability statement
The genome sequence data that support the findings of this study are openly available in GenBank of NCBI at https://www.ncbi.nlm.nih.gov under the accession number OM287125. The associated BioProject, SRA, and BioSample accession number are PRJNA797163, SRR17617338, and SAMN24966706 respectively.