
Figures & data
Figure 1. Graphic representation of features identified in I. japonica chloroplast genome using CPGAVAS2 (http://47.96.249.172:16019/analyzer/view). The map contains four circles. From the center going outward, the first circle shows the distributed repeats connected with red (the forward direction) and green (the reverse direction) arcs. The next circle shows the tandem repeats marked with short bars. The third circle shows the LSC, SSC, IRa, and IRb regions. The microsatellite sequences are shown as short bars on the circle. The fourth circle shows the genes having different colors based on the functional groups. The genes of the outside of the circle are transcribed clockwise. And the genes on the inside of the circle are transcribed anticlockwise. The functional classification is shown at the bottom left.
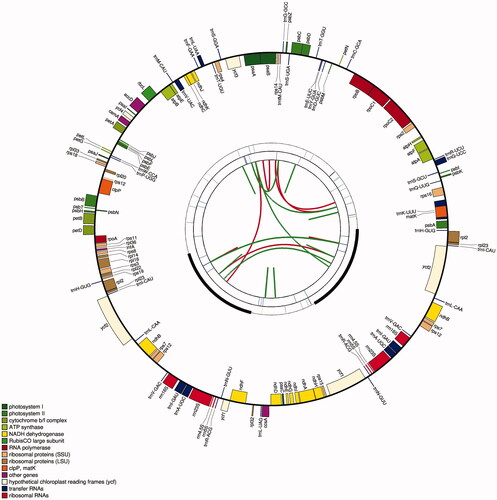
Figure 2. Sequence alignment of seven chloroplast genome of Iris species using mVISTA and chloroplast genome of I. lactea (NC_056175) as reference. The top arrow shows transcription direction, blue color indicates protein-coding regions, pink color shows non-coding sequences and light green indicates tRNAs and rRNAs. The x-axis represents the coordinates in the cp genome while y- axis represents percentage identity within 50–100%.
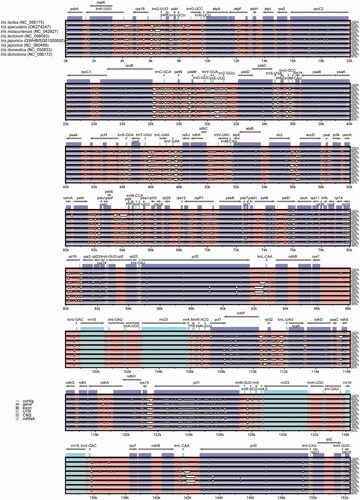
Figure 3. Comparison of LSC, SSC, and IR boundary areas of 21 Iris species.
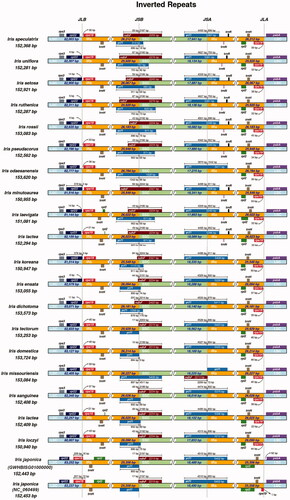
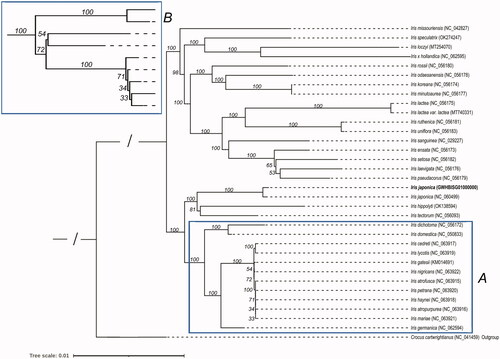
Figure 4. The phylogenetic tree of 21 Iris species. Crocus cartwrightianus was selected as the outgroup. The tree was constructed using the maximum-likelihood method based on the concatenated sequences from 66 shared proteins. Bootstrap support values were calculated from 1000 replicates. B box is a magnification of A box.
Supplemental Material
Download MS Word (1.2 MB)Data availability statement
The sample was stored at the Herbarium of the Institute of Medicinal Plant Development, Beijing, China, with the voucher numbers Implad201808209. The chloroplast genome sequence and the related annotations were available at https://ngdc.cncb.ac.cn/gwh in the Genome Warehouse in China National Genomics Data Center [38] with accession number GWHBISG01000000. The raw sequencing data for the Illumina platforms were deposited in CNCB-NGDC (https://ngdc.cncb.ac.cn/?lang=en). The accession numbers of Bioproject, Biosample, and GSA are PRJCA009243, SAMC781189, and CRA007000, respectively.