
Figures & data
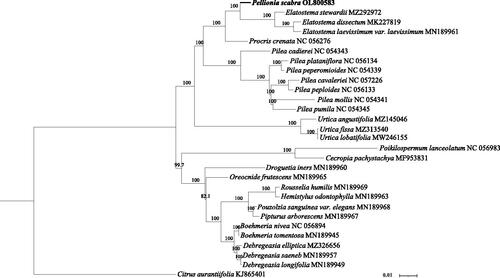
Figure 1. Maximum-likelihood tree of protein-coding gene sequences from the complete chloroplast sequences of Pellionia scabra Benth.1861 (Urticaceae) and 28 other plant species. The analysis was performed using 77 homologous protein-coding genes. Node values indicate bootstrap support (1000 replicates).
Data availability statement
The genome sequence data that support the findings of this study are openly available in GenBank (https://www.ncbi.nlm.nih.gov/) under accession number OL800583. The associated BioProject, SRA, and Bio-Sample numbers are PRJNA787431, SRR17177970, and SAMN23802974, respectively.