
Figures & data
Figure 1. Primula odontocalyx. This image is provided by the corresponding author Yuan Huang, and is used with permission.
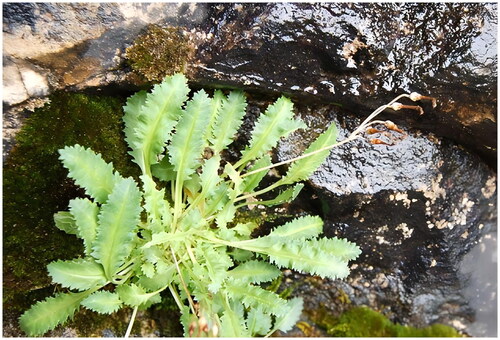
Figure 2. Genomic map of Primula odontocalyx chloroplast genome generated by CPGview. Genes drawn inside the circle are transcribed clockwise, and those outside are transcribed counterclockwise. Genes belonging to different functional groups are color-coded. The dashed area in the inner circle indicates the GC content of the chloroplast genome of Primula odontocalyx.
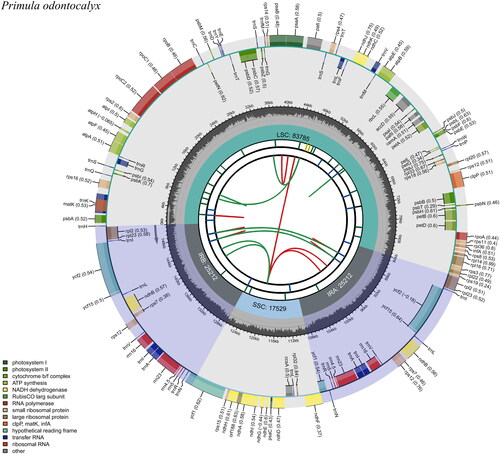
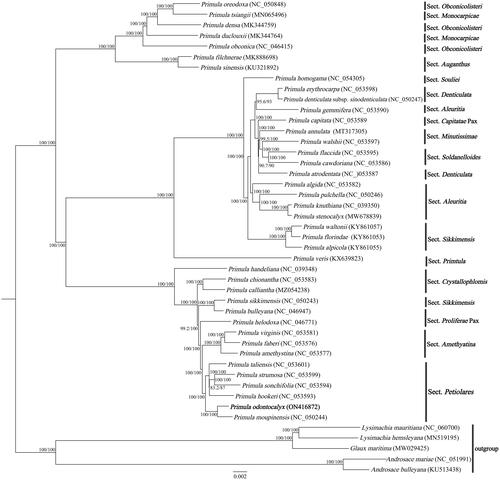
Figure 3. ML phylogenetic tree of Primula odontocalyx and 44 Primulaceae species based on chloroplast complete genomes, the branch supports values were reported as SH-aLRT/UFBoot.
Supplemental Material
Download JPEG Image (711.2 KB)
Supplemental Material
Download JPEG Image (88.1 KB)
Supplemental Material
Download JPEG Image (270.5 KB)
Data availability statement
The genome sequence data that support the findings of this study are openly available in GenBank of NCBI at [https://www.ncbi.nlm.nih.gov/] under accession no. ON416872. The associated BioProject, SRA, and Bio-Sample numbers are PRJNA834967, SRR19141931, and SAMN28088246, respectively.