
Figures & data
Figure 1. A flowering T. lanceolata.

Figure 2. Chloroplast genome map of T. lanceolata. Genes drawn outside the outer circle are transcribed clockwise, and those inside are transcribed counter-clockwise. Genes belonging to diferent functional groups are color-coded. The dark gray in the inner circle indicates GC content of the chloroplast genomes.
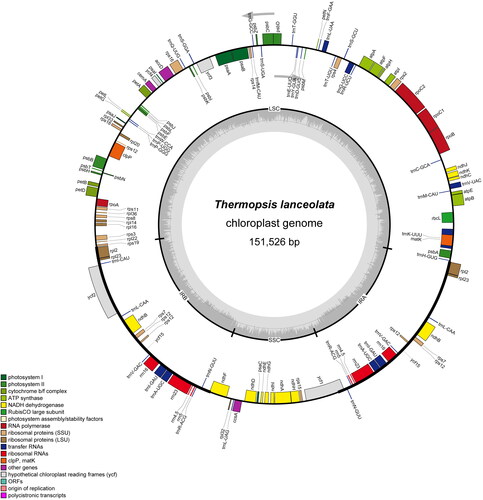
Table 1. Gene composition information and functional classification of T. lanceolata chloroplast genome.
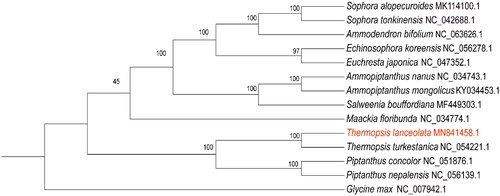
Figure 3. Phylogenetic tree for 14 Fabaceae species using Maximum Likelihood (ML) method, based on alignments of 64 protein-coding genes shared among 14 species, G. max was set as the outgroup. Numbers next to the branches indicated bootstrap values from 1000 replicates.
Supplemental Material
Download MS Word (13.2 KB)Data availability statement
The genome sequence data that support the findings of this study are openly available in GenBank of NCBI at [https://www.ncbi.nlm.nih.gov] (https://www.ncbi.nlm.nih.gov/) under the accession no. MN841458. The associated BioProject, SRA, and Bio-Sample numbers are PRJNA706880, SRR13871830, and SAMN18131232, respectively.