
Figures & data
Figure 1. A great cormorant subspecies, Phalacrocorax carbo hanedae, photographed by R. Honda at Gongen-numa Pond in Aomori, Japan. Two species of cormorants, P. carbo hanedae and P. capillatus, are known to inhabit Japan, which can be distinguished by the shape of the yellow bare part at the base of their beaks. The individual in the photo can be identified as P. carbo hanedae because the yellow bare part at the base of the beak is not pointed at the corner of the mouth.
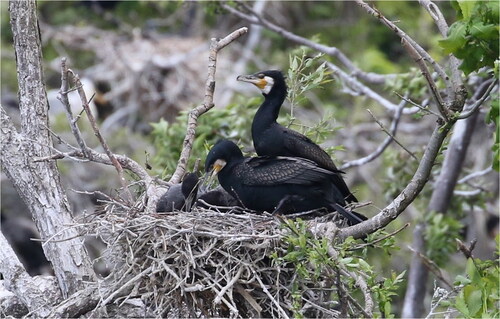
Figure 2. Gene map and organization of the complete mitochondrial genome of Phalacrocorax carbo hanedae, drawn by the OGDRAW version 1.3.1 (Grainer et al. Citation2019). Genes encoded on the heavy and light strand are shown outside and inside the circle, respectively. The inner grey ring indicates the GC content.
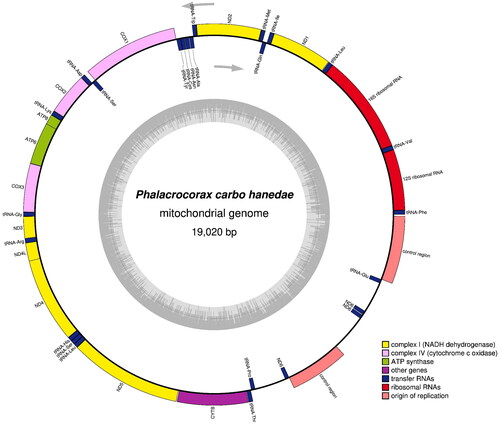
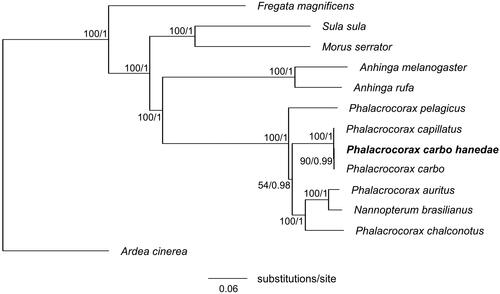
Figure 3. Maximum-likelihood tree of the order Suliformes based on the sequences of concatenated 13 protein-coding genes (PCGs) with the grey heron (Ardea cinerea) as an outgroup. Numbers beside each node indicate bootstrap support values for ML (left) and posterior probabilities support values for BI (right). The following sequences were used: Anhinga melanogaster MW042786 (Thomas et al. Citation2021), Anhinga rufa GU071055, Ardea cinerea KJ190947, Fregata magnificens MN356268, Morus serrator GU071056, Nannopterum brasilianus KT626611 (Rodrigues et al. Citation2017), Phalacrocorax auratus NC052822, Phalacrocorax capillatus LC714913 (Honda et al. Citation2022), Phalacrocorax carbo KR215630 (Zhang et al. Citation2017), Phalacrocorax carbo hanedae LC715365 (this study), Phalacrocorax chalconotus GU071054, Phalacrocorax pelagicus MN356399, and Sula sula LC541438.
Supplemental Material
Download JPEG Image (876 KB)
Supplemental Material
Download MS Word (22.2 KB)Data availability statement
The data that support the findings of this study are available in DDBJ at https://www.ddbj.nig.ac.jp/index-e.html under the accession no. LC715365. Gel image of long PCR products and Sanger sequencing results (ab1 files) are provided as electronic supplementary materials (Figure S1 and Data S1–S27).