
Figures & data
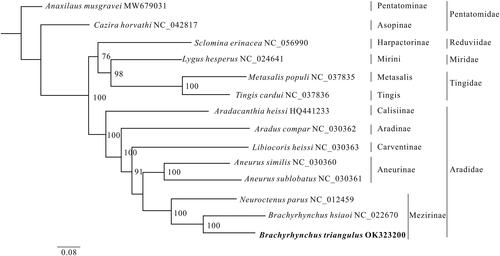
Figure 1. The phylogenetic relationships of the 14 species are derived from analysis of the combined 13 protein-coding sequence data based on the maximum-likelihood (ML) method. The best model is selected using ModelFinder (Kalyaanamoorthy et al. Citation2017) as GTR + F+I + G4, and later the ML tree is inferred from IQ-Tree v.1.6.8 (Lam-Tung et al. Citation2015). The node values are obtained with 1000 repetitions of bootstrap percentages.
Data availability statement
The genome sequence data that support the findings of this study are openly available in GenBank of NCBI at https://www.ncbi.nlm.nih.gov/ under the accession no. OK323200. The associated BioProject, SRA, and Bio-Sample numbers are PRJNA838196, SRR19226807, and SAMN28408660, respectively.