
Figures & data
Figure 1. Voucher photographs (A–D) of wild adult female Mobula alfredi (HAMER CatalogID#176 ‘Bullseye’) sampled from Maui Island, Hawai’i, USA in November 2010.
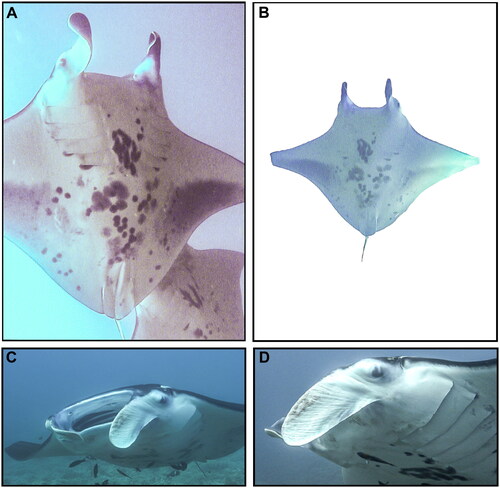
Figure 2. Map of the assembled Mobula alfredi mitochondrial genome (GenBank Accession: OP562409) consisting of 13 protein-coding genes (black), 22 transfer RNAs genes (red), two ribosomal RNA genes (light brown), and one non-coding control region (D-loop, dark brown). Genes encoded on the reverse strand and forward strand are illustrated inside the circle and outside the circle, respectively. The inner ring displays the GC content of the genome (every 5 bp), where the darker lines represent higher GC percent. This map was drawn using MitoAnnotator (Iwasaki et al. Citation2013).
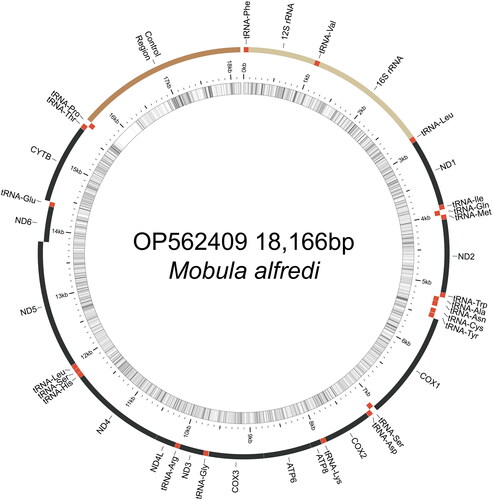
Table 1. Devil ray (Family Mobulidae) mitogenomes from Genbank.
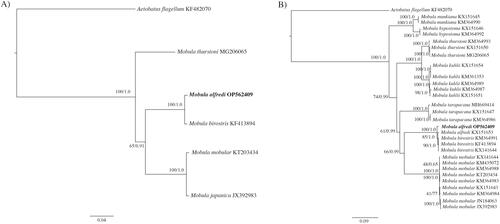
Figure 3. Molecular phylogenetic reconstruction of Mobula. Presented are rooted Bayesian trees based on (A) all available congeneric (n = 4) complete mitochondrial genomes (i.e. including the control region), and (B) all congeneric (n = 28) partial mitochondrial genomes (i.e. excluding the control region) (). Alignment and branch support analyses were performed in Geneious Prime v. 2022.0.1 The best fit sequence evolution model for both datasets, GTR + G (gamma = 0.2670, complete genome; gamma = 0.2650, partial genome), was identified by the Akaike Information Criterion using jModelTest v. 2.1 (Guindon and Gascuel Citation2003; Darriba et al. Citation2012). Phylogenetic reconstruction using a maximum likelihood (ML) analysis was created using PHYML v.3.0.1 (Guindon et al. Citation2010) as implemented in Geneious Prime with clade support assessed with 1000 non-parametric bootstrap replicates. Bayesian inference (BI) analysis was run using MrBayes v.2.2.4 (Huelsenbeck and Ronquist Citation2001; Ronquist and Huelsenbeck Citation2003) by running a pair of independent searches for 1 million generations, with trees saved every 1000 generations and the first 250 trees discarded as burn-in. Sequence divergence is represented on the scale bar. Branch support is presented as ML/BI. Aetobatus flagellum was selected as the outgroup. The resulting trees confirm the placement of OP562409 with M. alfredi, as sister to M. birostris and reinforces phylogenetic relationships established by previous studies (Poortvliet et al. Citation2015; White et al. Citation2017).
Supplemental Material
Download MS Word (22.6 KB)Data availability statement
The genome sequence data that support the findings of this study are openly available in GenBank of NCBI at [https://www.ncbi.nlm.nih.gov] under the accession no. OP562409. The associated BioProject, SRA, and BioSample accession numbers are PRJNA899543, SRR22233901, and SAMN31097093 respectively.