
Figures & data
Figure 1. Representative photograph of Poecilia parae (blue melanzona morph).
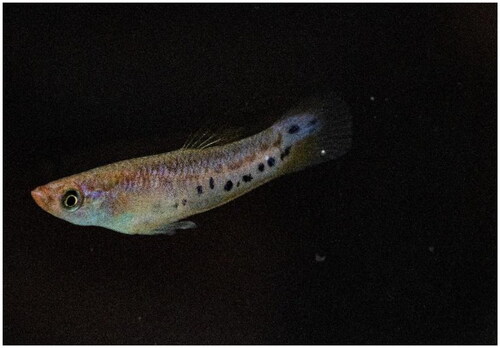
Figure 2. Mitochondrial genome map of Poecilia parae. The innermost circle of the image represents %GC per every 5 bp of the mitogenome; longer lines indicate higher %GC.
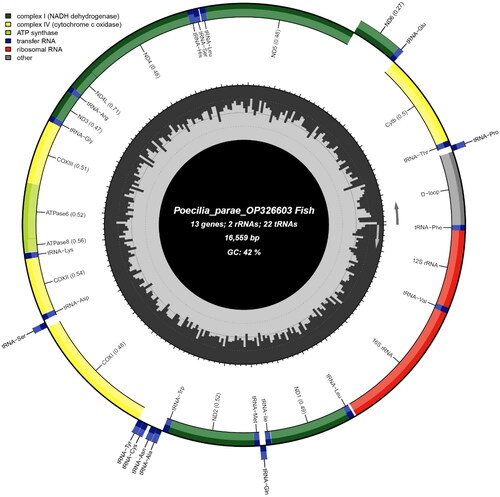
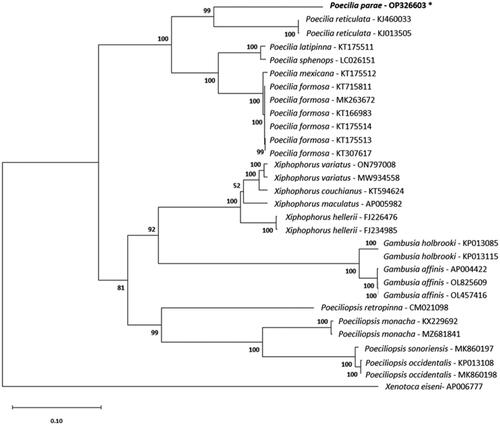
Figure 3. Maximum-likelihood phylogeny reconstructed using mitochondrial protein-coding sequences under the GTR + G+I model and 1000 bootstrap replicates. The following sequences were used: AP005982 (Miya et al. Citation2003), KT594624 (Zhang et al. Citation2016), MW934558 (Eastis et al. Citation2021), ON797008, FJ226476 (Bai et al. Citation2009), FJ234985 (Bai et al. Citation2009), CM021098 (van Kruistum et al. Citation2020), KJ013505 (Kong et al. Citation2016), KJ460033 Künstner et al. (Citation2016), OP326603 (this study), KT166983 (Dang et al. Citation2016), KT175513, KT307617 (Sung et al. Citation2016), KT715811, MK263672, KT175514, KT175512, KT175511, LC026151 (Jiang et al. Citation2016), KX229692 (Jeon et al. Citation2016), MZ681841, MK860197 (Mateos et al. Citation2019), KP013108, MK860198 (Mateos et al. Citation2019), OL825609, OL457416, AP004422 (Miya et al. Citation2003), KP013085, KP013115, and AP006777 (Setiamarga et al. Citation2008). Numbers on nodes are bootstrap support values. The sequence generated in this study is written in bold font and marked with an asterisk.
Supplemental Material
Download MS Word (30.3 KB)Data availability statement
The data that support the findings of this study are openly available in GenBank of NCBI at https://www.ncbi.nlm.nih.gov, reference number OP326603. The associated BioProject, SRA, and BioSample numbers are PRJNA742674, SRR21296950, and SAMN30561436, respectively.