
Figures & data
Figure 1. Morphological characteristics of S. alata (ICROPS 2019 149) used for chloroplast genome sequencing; whole plant (a), inflorescence (b), floret (c) pod (d) and seed (e). (Photo source: ©CBGR Laboratory, ICropS, CAFS, UPLB).
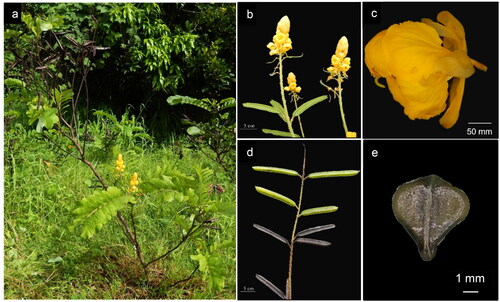
Figure 2. Chloroplast genome map of S. alata. The map contains seven circles, where the first circle (from the center going outward) shows the distributed repeats connected with red (the forward direction) and green (the reverse direction) arcs. The second circle shows the tandem repeats marked with short bars. The next circle shows the microsatellite sequences as short bars. The fourth circle shows the size of the LSC and SSC. The fifth circle shows the IRA and IRB while the sixth circle shows the GC contents along the plastome. The seventh circle shows the genes having different colors based on their functional groups.
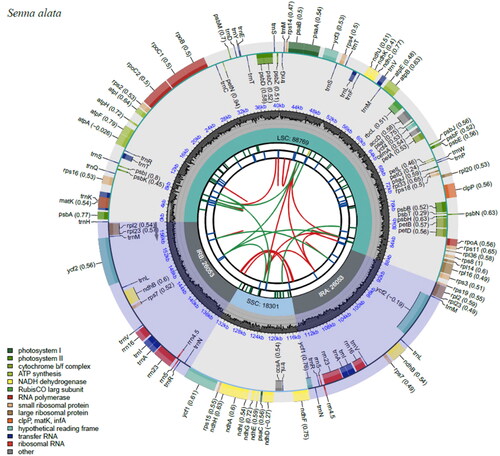
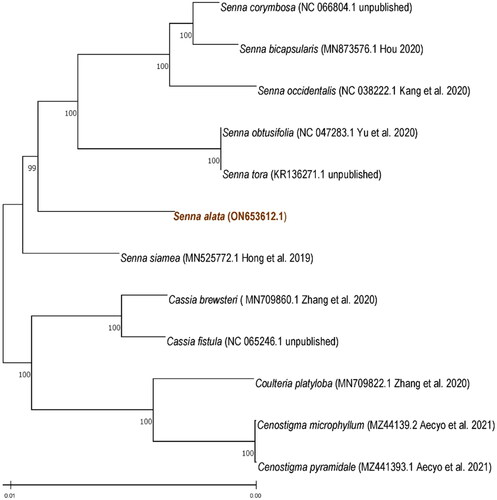
Figure 3. Phylogenetic tree reconstructed using maximum likelihood (ML) method based on complete chloroplast genome sequences of the nine Fabaceae species. Numbers above the lines represent ML bootstrap values (>98%).
Supplemental Material
Download MS Word (278.1 KB)Data availability statement
The genome sequence data that support the findings of this study are openly available in GenBank of NCBI at https://www.ncbi.nlm.nih.govunder the accession no. ON653612. The associated BioProject, SRA, and Bio-Sample numbers are PRJNA867486, SRR20980268 and SAMN30201905, respectively.