
Figures & data
Figure 1. The reference image of the plant of Bambusa tuldoides f. swolleninternode (taken by the authors; A: whole plant; B: aboveground stems of plant).
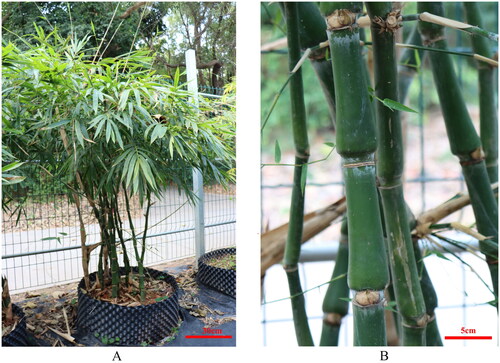
Figure 2. The read coverage depth map of the assembly of the chloroplast genome of Bambusa tuldoides f. swolleninternode (the figure means the coverage depth on each base of chloroplast genome of Bambusa tuldoides f. swolleninternode; X-axis indicates the location of bases in the genome; Y-axis indicates the coverage depth).
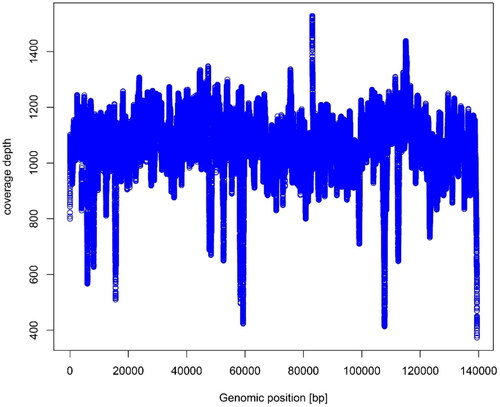
Figure 3. Chloroplast genome map of Bambusa tuldoides f. swolleninternode. The purple areas indicate the extent of the inverted repeats (IRA and IRB), which separate the genome into small (SSC) and large (LSC) single copy regions. Genes reside on the inside and outside of the outer circle are in the forward and reverse directions, respectively. Boxes on the outside and inside of the outer circle respectively represent genes transcribed clockwise and anti-clockwise. The dark and light gray bars in the inner circle denote G + C and A + T contents, respectively.
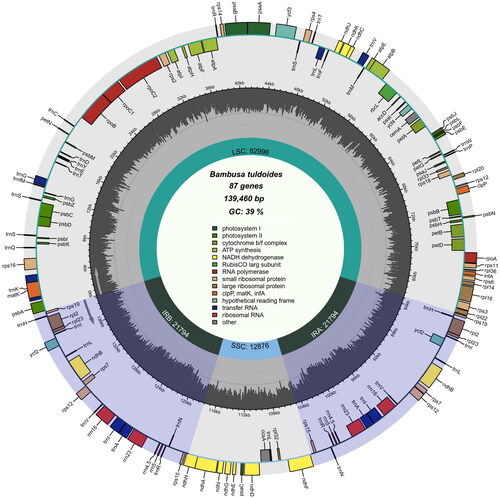
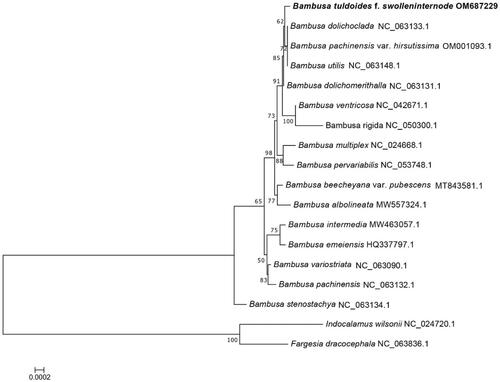
Figure 4. Phylogenetic tree of 16-taxon data of Bambusa set based on 71 chloroplast protein-coding genes using best-fit and JTT + F+R2 model. Indocalamus wilsonii and Fargesia dracocephala were selected as outgroups.
Supplemental Material
Download MS Word (326 KB)Data availability statement
The genome sequence data that support the findings of this study are openly available in GenBank of the NCBI under the accession number of OM687229 (https://www.ncbi.nlm.nih.gov/nuccore/OM687229.1/). The associated BioProject, SRA, and Bio-Sample numbers are PRJNA884087, SRR21700304, and SAMN31008065, respectively.