
Figures & data
Figure 1. Morphological characteristics of Quercus kerrii. Quercus kerrii is a tree to 30 m tall. Branchlets densely tawny tomentose, glabrescent, or rarely remaining hairy. Petiole 1–2 cm, tomentose; leaf blade oblong-elliptic, lanceolate, or oblong-oblanceolate, abaxially stellate hairy. Cupule discoid, covering base to 1/2 of nut, outside grayish to pale brown tomentose. Nut oblate apex depressed to flat. Photos were taken by Xiao-Long JIANG in Lincang, Yunnan Province, China.
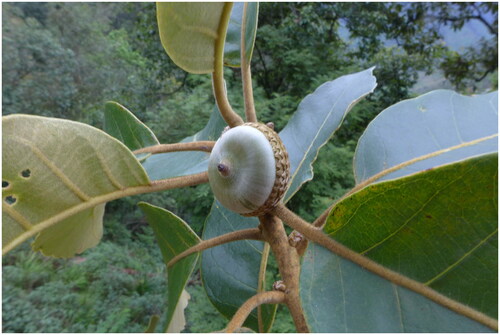
Figure 2. Characterization of the chloroplast genome of Quercus kerrii. From the center going outward, the first circle shows the distribution of the repeats connected with red (the forward direction) and green (the reverse direction) arcs. The second circle shows the tandem repeats marked with short bars. The third circle shows the LSC, SSC, IRa, and IRb regions. The fourth circle shows the percent of GC content. The next circle shows the genes having different colors based on the functional groups. The functional classification is shown at the bottom left.
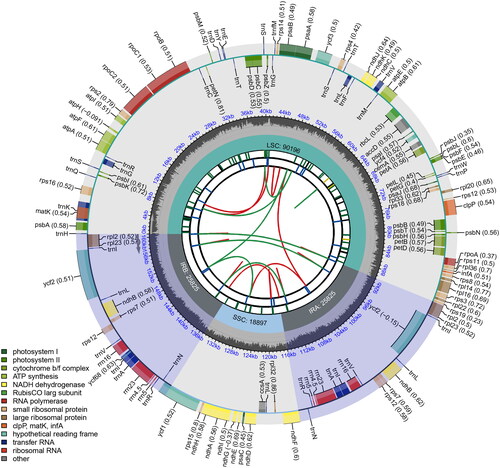
Figure 3. Depth of coverage of the data used to assemble the chloroplast genome of Quercus kerrii.
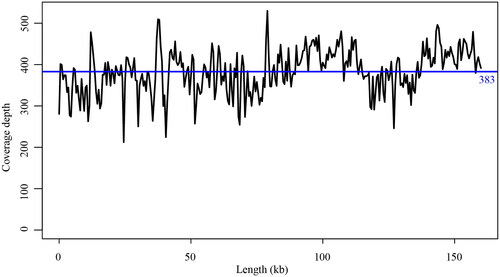
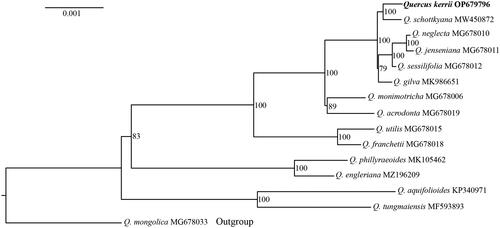
Figure 4. The maximum-likelihood phylogenetic tree of Quercus kerrii and other 14 East Asian oaks using complete chloroplast genome sequences. Quercus mongolica (subgenus Quercus section Quercus) was used as outgroup to root the tree. The values at the node indicate the bootstrap support value.
Data availability statement
The assembly chloroplast genome sequence of Quercus kerrii is available in GenBank of NCBI (https://www.ncbi.nlm.nih.gov/) under the accession numbers OP679796.1. The associated BioProject, SRA, and Bio-Sample numbers are PRJNA891795, SRR21966525, and SAMN31336113, respectively.