
Figures & data
Figure 1. The individual, raceme, flower and capsule photograph of T. arceuthoides (B, D, F, and H) and T. ramosissima (A, C, E, and G), photo by Xiyong Wang at Turpan Eremophytes Botanical Garden. Main identifying traits: When T. ramosissima flowers, the petals are completely open, and the petals do not persist at fruit stage, but fall off directly and T. arceuthoides flowers cup shaped when flowering, petals persistent in fruit, attached to the base of the fruit.
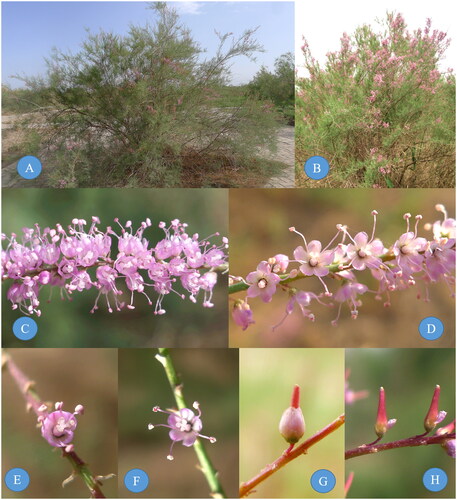
Figure 2. Chloroplast genome maps for T. arceuthoides and T. ramosissima. Genes on the inside of the circle are transcribed clockwise and those on the outside are transcribed counterclockwise. The darker gray inner circle corresponds to the GC content, whereas the lighter gray indicates the AT content. Different colors represent different functional genes. The thick lines of the large circle indicate the extent of the inverted repeat regions (IRa and IRb) that separate the genome into small single-copy (SSC) and large single-copy (LSC) regions, respectively.
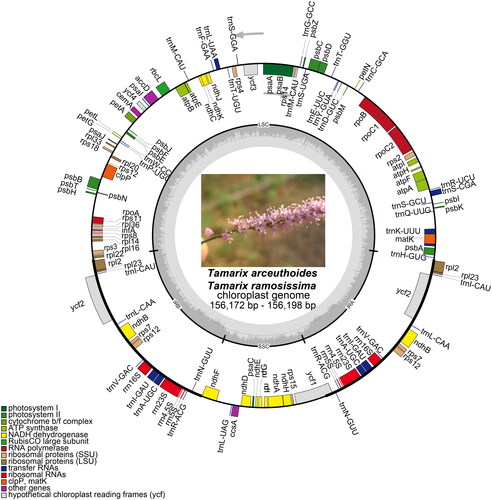
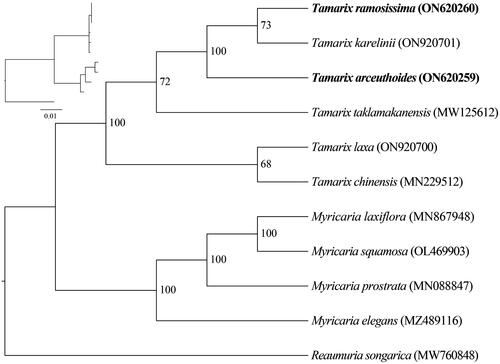
Figure 3. Phylogenetic trees inferred from maximum-likelihood (ML) analyses based on 12 complete chloroplast genomes using Reaumuria songarica as an outgroup with 1000 bootstraps replicates. The numbers above the branches indicate the bootstrap values. The following sequences were used: Reaumuria songarica MW760848 (Duan Y et al. 2021), Myricaria elegans MZ489116 (Su T and Han M 2021), Myricaria laxiflora MN867948 (Wang et al. Citation2020), Myricaria prostrata MN088847 (Chi X 2020), Myricaria squamosa OL469903 (Yu L 2022), Tamarix chinensis MN229512 (Chi Citation2019), Tamarix karelinii ON920701 (Song S 2022), Tamarix laxa ON920700 (Song S 2022), and Tamarix taklamakanensis MW125612 (Yang T 2020).
Supplemental Material
Download JPEG Image (256.8 KB)
Supplemental Material
Download JPEG Image (170.7 KB)
Supplemental Material
Download JPEG Image (256.9 KB)
Supplemental Material
Download PNG Image (22.4 KB)
Supplemental Material
Download PNG Image (22.5 KB)
Supplemental Material
Download MS Word (16.6 KB)Data availability statement
The genome sequence data that support the findings of this study are openly available in GenBank of NCBI at https://www.ncbi.nlm.nih.gov under accession nos. ON620259 and ON620260. The associated BioProjects are PRJNA890384 and PRJNA890011; SRA are SRR21901739 and SRR21889044; and the Bio-Sample numbers are SAMN31264515 and SAMN31266535, respectively.