
Figures & data
Figure 1. An image of the Ziziphus jujuba Mill. ‘Fengmiguan’ variety. This image was taken from the experimental base of Hebei Agriculture University, Baoding, Hebei Province, China.
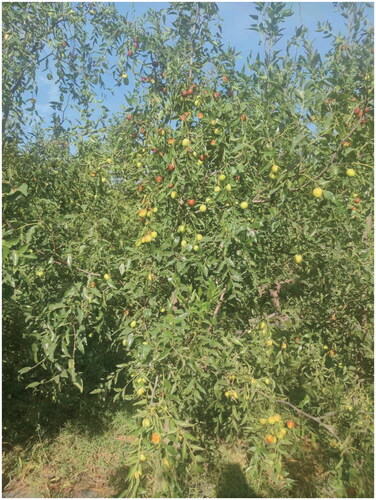
Figure 2. Schematic of the ‘Fengmiguan’ jujube chloroplast genome. The map contains six tracks. From the center outward, the first track shows the dispersed repeats. The dispersed repeats consist of direct (D) and palindromic (P) repeats, connected with red and green arcs. The second track shows the long tandem repeats as short blue bars. The third track shows the short tandem repeats or microsatellite sequences as short bars with different colors. The colors, type of repeat they represent, and the description of the repeat types are as follows: black: c (complex repeat); green: p1 (repeat unit size = 1); yellow: p2 (repeat unit size = 2); purple: p3 (repeat unit size = 3); blue: p4 (repeat unit size = 4); orange: p5 (repeat unit size = 5); red: p6 (repeat unit size = 6). The small single-copy (SSC), inverted repeat (IRa and IRb), and large single-copy (LSC) regions are shown on the fourth track. The GC content along the genome is plotted on the fifth track. Genes are color-coded according to their functional classification. The transcription directions for the inner and outer genes are clockwise and anticlockwise, respectively. The key for the functional classification of the genes is shown in the bottom left corner.
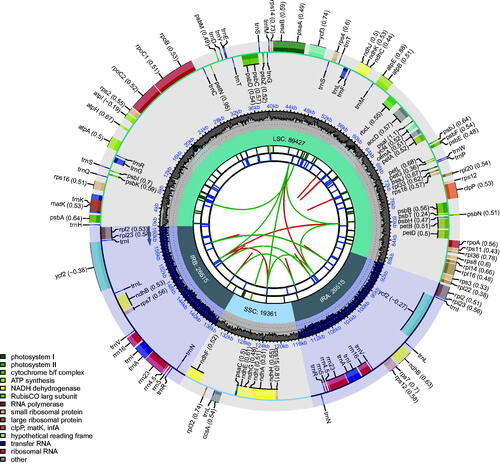
Figure 3. The phylogenetic tree including two outgroups (Elaeagnus conferta and Elaeagnus umbellata) and one Berchemiella, two Ventilago, four Rhamnus, three Berchemia, four Hovenia, four Spyridium, and 11 Ziziphus species. This tree is based on DNA sequences and was constructed using the maximum-likelihood (ML) method. The numbers next to each node indicate the percentage of bootstrap support for 1000 replicates, and all nodes without numbers are 100% supported by the bootstrap sampling test.
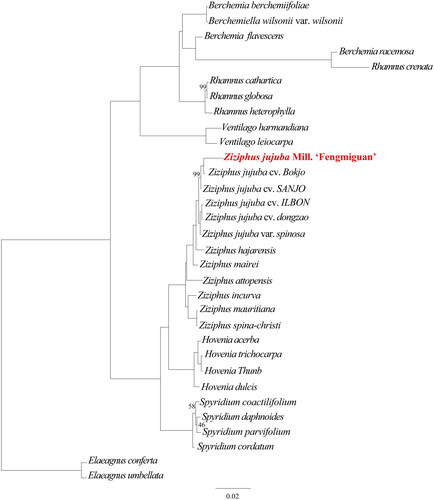
Table 1. NCBI accession numbers and citations for the sources of the 31 species used in the construction of the phylogenetic tree.
Data availability statement
The genome sequence data obtained in this study are openly available in the GenBank of NCBI at https://www.ncbi.nlm.nih.gov/ under the accession number OP537226. The associated BioProject, Bio-Sample, and SRA numbers are PRJNA884017, SAMN31006321, and SRR22243258, respectively.