
Figures & data
Figure 1. Appearance of Longshengcui duck. The photo was taken by the authors.
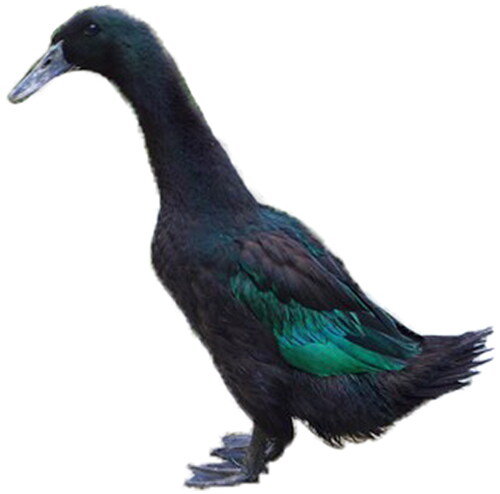
Figure 2. Mitochondrial genome map of Longshengcui duck. The inner circle indicates the GC content, and the external circle indicates the genes having different colors based on their functions. The arrows represent direction of transcription, genes encoded on the heavy and light strand are shown outside and inside the circle, respectively.
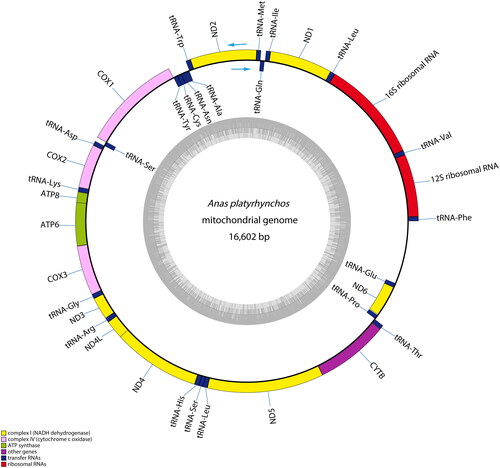
Table 1. Organization of the mitochondrial genome of Longshengcui duck.
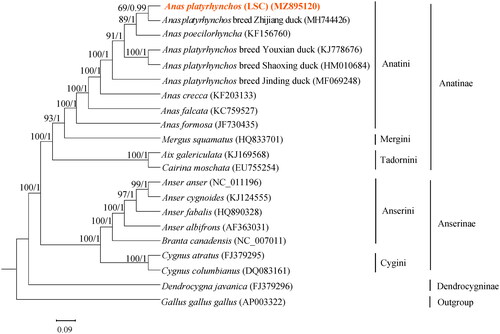
Figure 3. Phylogenetic analysis based on complete mitochondrial genome sequences. An ML/BI tree was built based on the phylogenetic analysis of 20 Anseriform species’ complete mitochondrial genomes. The mitochondrial genome sequences of the Anseriform species were obtained from the GenBank databases (accession numbers have marked on the figure). Abbreviation of species indicates: LSC, Longshengcui duck.
Supplemental Material
Download MS Word (22.2 KB)Data availability statement
The data that support the findings of this study are openly available in GenBank of NCBI at (https://www.ncbi.nlm.nih.gov/) under the accession no. MZ895120.