
Figures & data
Figure 1. Photographs showing (A) Oncorhynchus gilae (photo credit: Thomas Kennedy, used with permission) and (B) Macrhybopsis tetranema (photo credit: Daniel Fenner, used with permission). Oncorhynchus gilae are characterized by having a stocky, golden-yellowish body, large spots on the adipose fin, numerous fine spots above the lateral line and large spots on the adipose fin (Behnke Citation2002).
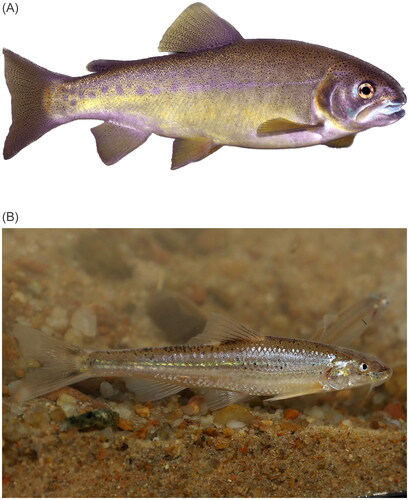
Figure 2. Mitochondrial genome maps showing 13 protein coding genes, 2 ribosomal RNAs, 22 transfer RNAs and the control region (D-loop) for (A) Oncorhynchus gilae (GenBank: OQ301638) and (B) Macrhybopsis tetranema (GenBank: OQ301637) generated using the program proksee v. 6.0.2 (https://proksee.ca/) using the relative scale option. Plots of GC content and skew used a window size of 500 and reflect GC content/skew scores on a scale of 0 to 1 using a baseline of 0.5. Positive and negative skew are indicated by values above and below the midpoint respectively. Asterisks in the control region indicate the approximate location and number of repetitive elements. The order of mitochondrial genes is conserved between species.
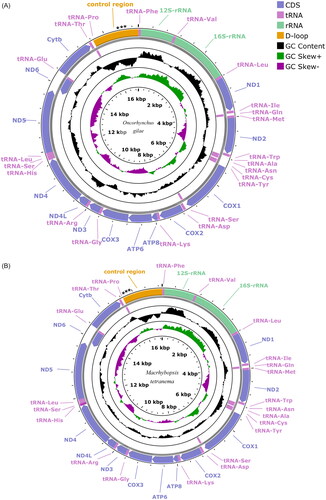
Figure 3. Maximum likelihood trees constructed with the coding sequences of the mitochondrial genomes (A) from Oncorhynchus species including the Spruce Creek lineage of O. gilae (GenBank: OQ301638). Coho salmon (Oncorhynchus kisutch) was included as an outgroup. (B) a subset of cypriniform fishes, including M. tetranema (GenBank: OQ301637) new mitogenome. Roundnose minnow (Dionda episcopa) was included as an outgroup. Node support values were generated with 100 bootstrap replicates. Asterisks and light blue highlighting denote novel sequences presented in this study. GenBank accession numbers are provided near branch tips for all sequences used. References used for comparative analysis are provided in the .
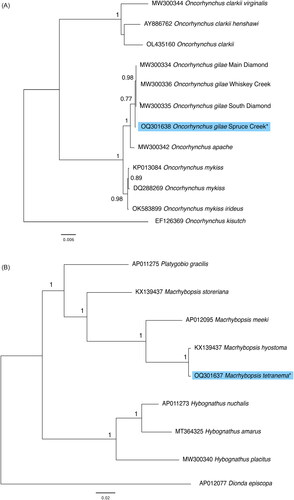
Table 1. List of species, GenBank accession numbers and references for sequences used to construct phylogenetic trees ( and ).
Supplemental Material
Download MS Word (182.4 KB)Data availability statement
The mitogenome sequence data that support the findings of this study are openly available at NCBI Genbank (https://www.ncbi.nlm.nih.gov/genbank/) under the accession no. OQ301638 for O. gilae and OQ301637 for M. tetranema. The associated sequencing data is available at NCBI Sequence Read Archive (SRA; https://www.ncbi.nlm.nih.gov/sra/). For O. gilae the associated BioProject, BioSample and SRA numbers are PRJNA941852, SAMN33611619 and SRR23721617, respectively; for M. tetranema the associated BioProject, BioSample and SRA numbers are PRJNA941280, SAMN33600811 and SRR24116728, respectively.