
Figures & data
Figure 1. Dorsal view of a male Tethea albicostata. The image is referenced from the bold systems (Ratnasingham and Hebert Citation2007). The sample ID is SDNU-INS-01482. This figure is attribution noncommercial sharing. http://v3.boldsystems.org/index.php/taxbrowser_taxonpage?taxon=Tethea+albicostata&searchTax=.
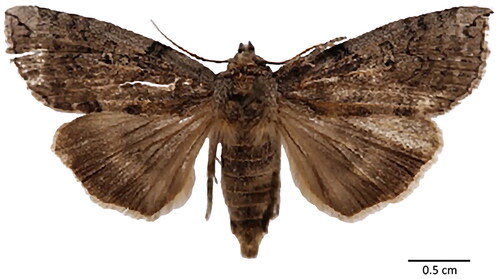
Figure 2. The complete mitochondrial genome map of Tethea albicostata. Genes belonging to different functional groups are color coded. Genes are shown outside and inside the outer circle are transcribed counterclockwise and clockwise, respectively. The inner circle represents the GC% along the mitochondrion.
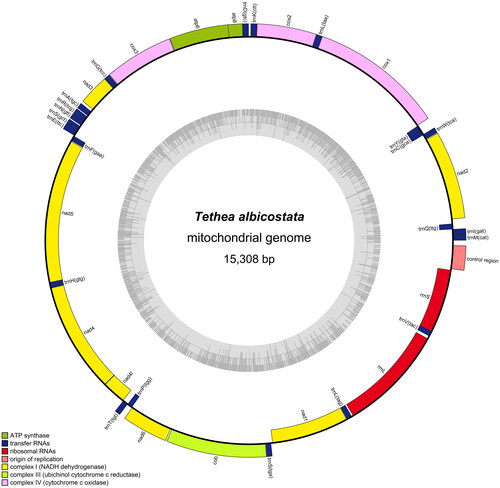
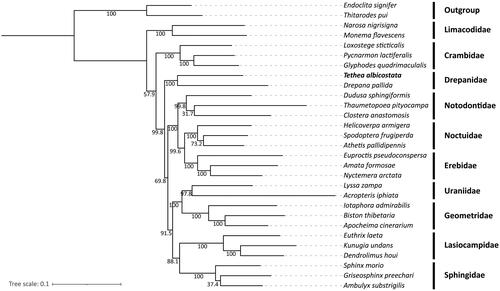
Figure 3. Maximum-likelihood (ML) tree of 29 Lepidopteran species based on the complete mitogenome sequences. Endoclita signifer and Thitarodes pui were used as outgroups. The numbers below the branches were the bootstrap values. A summary of the 29 Lepidoptera species used in the phylogenetic tree is shown in Supporting Information Table S1.
Supplemental Material
Download MS Word (6.5 MB)Supplemental Material
Download MS Word (222.9 KB)Supplemental Material
Download MS Word (3.6 MB)Supplemental Material
Download MS Word (22.2 KB)Supplemental Material
Download PDF (310.2 KB)Data availability statement
The genome sequence data that support the findings of this study are openly available in GenBank of NCBI at (https://www.ncbi.nlm.nih.gov/) under accession no. OK149234. The associated BioProject, BioSample, and SRA numbers are PRJNA810316, SAMN26244873, and SRR18148899, respectively.