
Figures & data
Figure 1. The specimen and picture of the Jatropha curcas L. The specimen of J. curcas was deposited at the Atlas of Florida Plants, operated by the Institute for Systematic Botany at the University of South Florida (https://Florida.plantatlas.usf.edu/Default.aspx) under the accession number: 106202 (A). Picture of J. curcas was taken and provided by Won Joo Hwang (B).
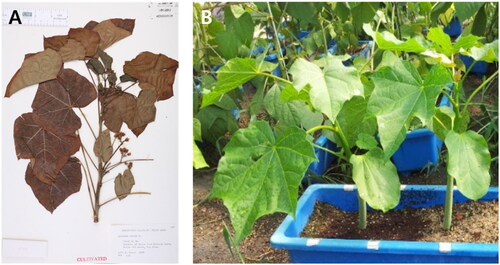
Figure 2. Map of Jatropha curcas mitochondrial genome. The genes annotated outside the circular genome are in the forward orientation, whereas the genes inside the circle are in the reverse orientation. Genes with asterisk mark indicate cis-splicing genes.
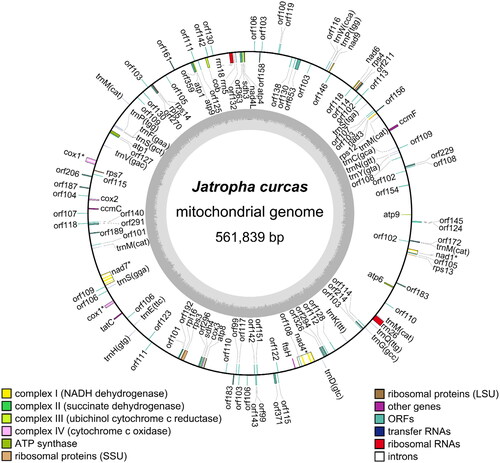
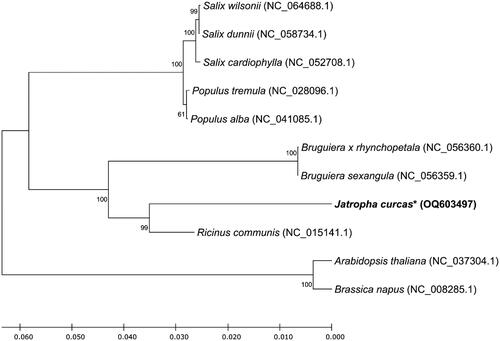
Figure 3. Unrooted phylogenetic tree of mitochondrial genome sequences of Malpighiales. The phylogenetic tree was constructed using the maximum-likelihood (ML) method with Jones–Taylor–Thornton (JTT) matrix-based model and 1000 times bootstrap replications. The protein sequences of mitochondrial genes from nine Malpighiales and two outgroup plants (Arabidopsis thaliana and Brassica napus) were used. Bootstrap values indicate the topology of the tree. The asterisk mark indicates the plant species investigated in this study.
Supplemental Material
Download PDF (288.4 KB)Supplemental Material
Download MS Word (1.5 MB)Data availability statement
The data that support the findings of this study are openly available in GenBank of NCBI at https://www.ncbi.nlm.nih.gov/ under accession no. OQ603497. The associated BioProject, SRA, and Bio-Sample numbers are PRJNA399212, SRR5974849, SRR5974850, and SAMN07527279, respectively.